
DXLook User Guide
How to read the live HF/VHF propagation map — every view and widget explained, with a friendly primer for anyone new to amateur radio.
1Welcome
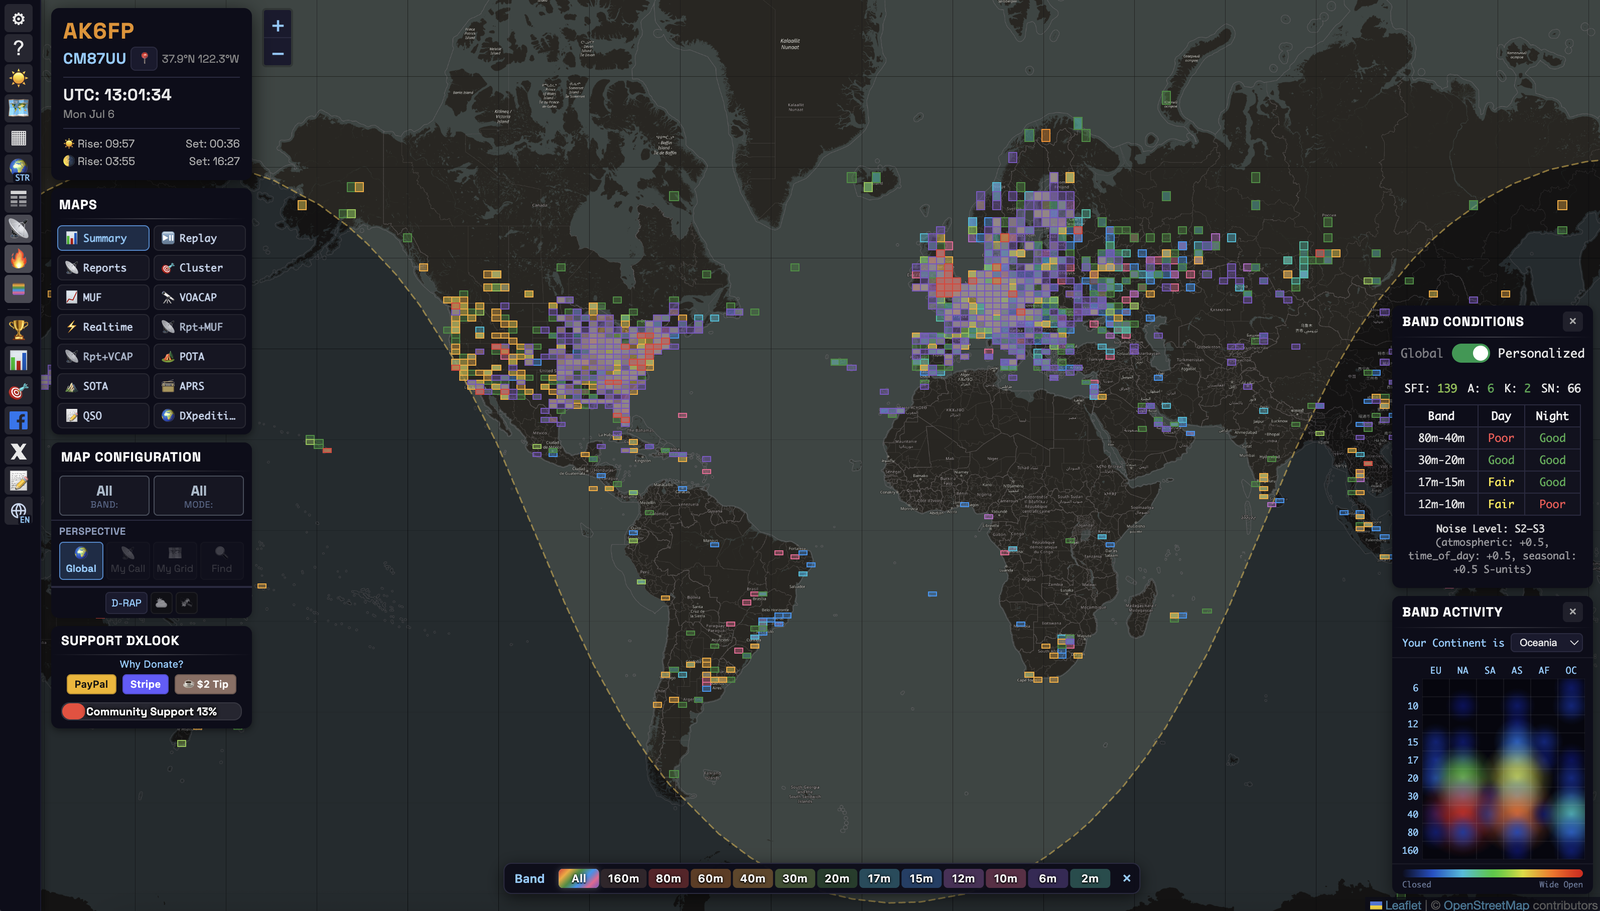
DXLook is a live map of amateur-radio activity and propagation. It listens to real-time “spots” from around the world — automatic reports of who is hearing whom — and draws them on an interactive globe alongside space-weather data.
In one glance you can see which bands are open, where your signal is landing, and where the interesting stations are, right now. You don’t need an account. Enter your callsign and/or location once and DXLook tailors everything to your station.
A few words you’ll see everywhere:
- Spot — an automatic “I heard this station” report. DXLook is built from millions of these.
- DX — a distant or hard-to-work station (loosely, “long-distance”).
- QSO — a two-way contact (a completed conversation between two stations).
- CQ — a general “anyone want to talk?” call.
- Band — a slice of radio spectrum hams may use (like a lane on a highway). Each band behaves differently — that’s most of what this guide is about.
- Propagation — how far and where your signal travels. It changes hour to hour with the sun (next section).
Why DXLook instead of a plain cluster or a prediction site? It shows what’s actually being heard (live spots, plus a measured MUF worked out from those real spots) and a separate theoretical forecast (VOACAP) — on the same map, so you can lay one over the other and check the forecast against reality.
2How propagation works (the 60-second version)
Radio signals on the HF bands don’t just travel in a straight line — they bounce off the ionosphere, a layer of the atmosphere ~100–400 km up. That’s how a modest station in California is heard in Japan.
The sun controls everything. Sunlight “charges up” the ionosphere, so it reflects signals well by day and differently by night. When the sun is active (lots of sunspots), the higher bands come alive for worldwide DX. When a solar flare erupts, it can absorb signals and black out the low bands on the daylit side of the Earth.
| Band group | Tends to be best… | Good for |
|---|---|---|
| Low — 160, 80, 60, 40 m | night, and around dawn/dusk | regional to medium distance; DX at night |
| Mid — 30, 20, 17 m | day and night; 20 m is the workhorse | all-round DX |
| High — 15, 12, 10 m | daytime, when the sun is active | long-haul DX, big signals |
| VHF — 6, 2 m | mostly local, with occasional openings | local nets; sporadic-E & tropo DX |
“Is the band open?” isn’t a yes/no — it depends on the band, the time of day, the path you want, and the sun. DXLook answers it visually: spots show what’s working now, the MUF (measured from real spots) shows how high the bands are currently reaching, and VOACAP forecasts what should work.
3Quick Start
You can browse with zero setup, but two fields unlock everything.
Step 1 — Tell DXLook who and where you are.
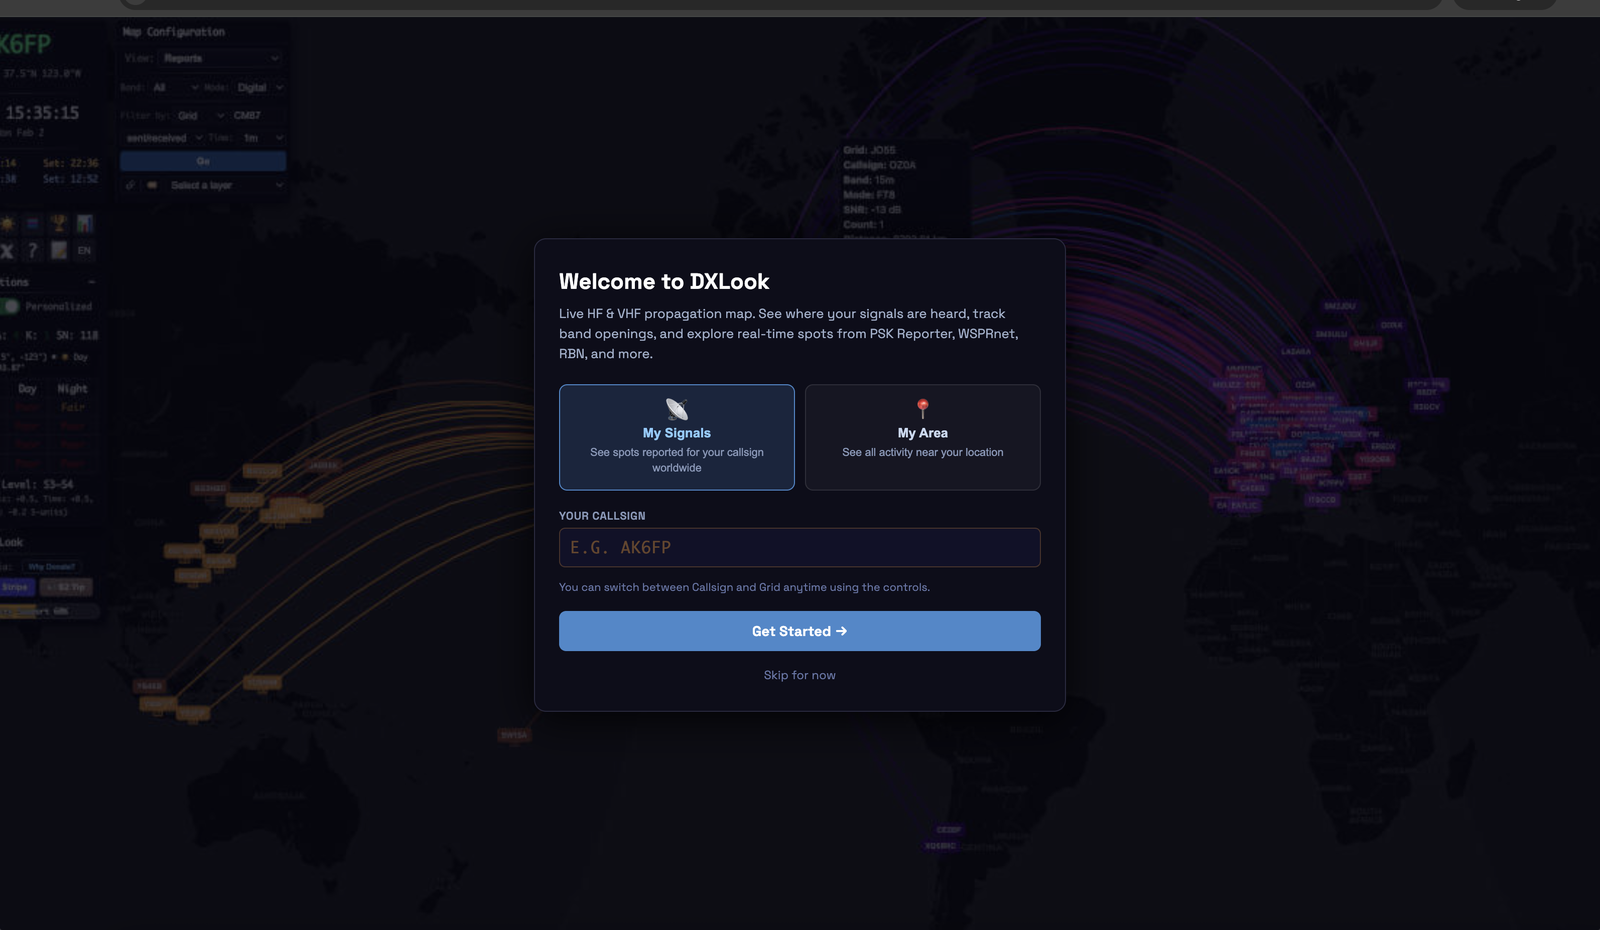
On first visit the welcome screen offers two ways in:
- My Signals — enter your callsign (e.g.
AK6FP) to see where you are being heard worldwide. - My Area — enter your grid square (e.g.
CM87) or tap Use my location to see activity around you.
A short code for your location — CM87 pins you to a ~150 km box; add two more characters (CM87wk) for a ~9 km box. It’s the standard way hams exchange locations. Don’t know yours? Tap Use my location and DXLook fills it in.
Change these anytime in the Station Info panel (top-left). Setting a grid also unlocks the azimuthal projection, personalized band conditions, and the location-based views — Reports, Realtime, Cluster, MUF and VOACAP — all centered on your QTH (“QTH” = your station’s location).
Step 2 — Pick a band and a mode.
In Map Configuration, choose a band (160m–2m, or All) and a mode (All / Digital / CW / Voice). The map re-filters instantly.
Step 3 — Read the map.
Every colored line or square is real activity. The one rule that holds everywhere: color = band. (A few views use color for something else — the Band Activity heatmap uses red = busy, APRS uses color for distance — and each says so where it appears.) Hover or tap anything for details.
- “Where am I being heard?” → Reports view · My Call perspective.
- “What’s open from my place right now?” → Band Conditions widget (Personalized) + the MUF view.
- “Is 10 m being used in Europe?” → Summary or Band Activity filtered to 10 m (these show where a band is active). “Is 10 m open on my path to Europe?” is a different question → MUF or VOACAP from your grid, or your own Reports arcs.
4Reading the map
Everything is built from a few consistent rules. Learn them once and every view reads the same.
Spots and paths. A spot is one station hearing another at a moment in time. DXLook draws the radio path as a great-circle arc — the shortest path over the curved Earth (it looks curved on a flat map, but it’s the real route). Endpoints show as grid squares or pins.
Color = band. Every band has one fixed color, used everywhere. Open the Band Legend (🎨 in the toolbar) to see the mapping; in band-filtered views, click a band there to show only it.
Day and night. The map draws the grey line — the moving twilight boundary between day and night.
The low bands open up along and just after it, and the grey line itself is a well-known sweet spot for long-distance contacts. Watching it sweep across the map (especially in Replay) teaches you a band’s daily rhythm.
Two map projections (toggle with 🗺):
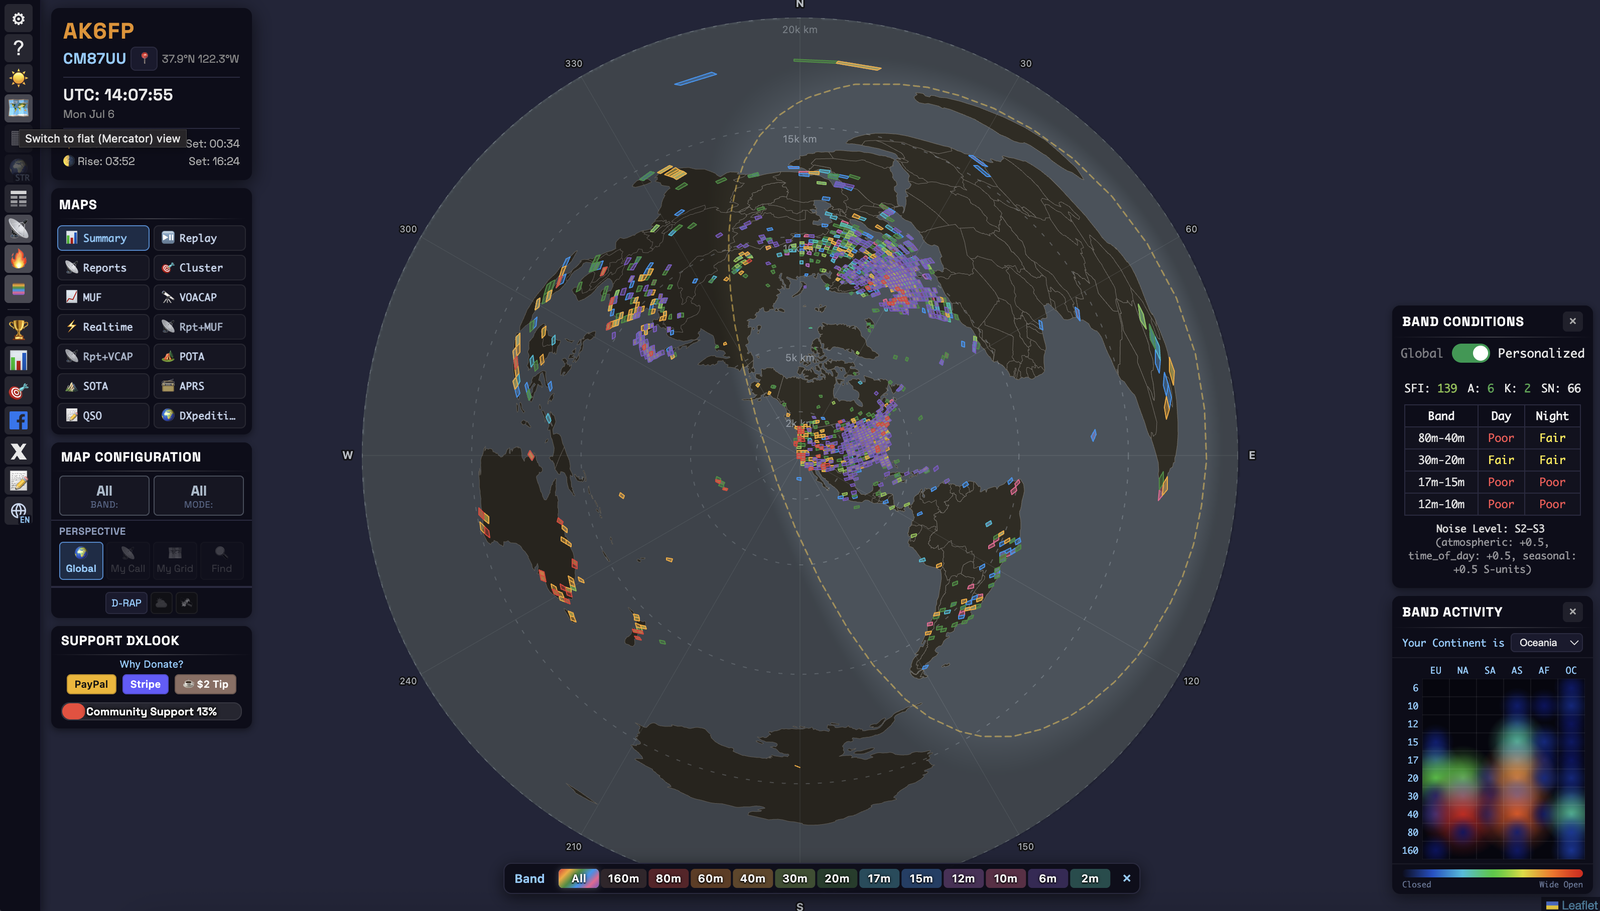
- Flat (Mercator) — the familiar rectangular world map. Best for general browsing and zooming into a region. It stretches areas near the poles (Greenland looks about as big as Africa, though it’s ~14× smaller).
- Azimuthal Equidistant — a circular map centered on your location. It’s the DXer’s projection for two reasons: every path from your station is a straight line, and the direction from the center is the true compass bearing to the far station — so you can point a directional antenna straight off the map.
Dark / light (☀️/🌙) suits your shack lighting. A high-contrast, colorblind-friendly band palette is available in Settings. Scroll or pinch to zoom, drag or one-finger to pan; click the active view button again to re-center and refresh.
5Core concepts
Short primers — skim what you know, read what you don’t.
Maidenhead grid locator
A compact code for a location. CM87 ≈ a 150 km box; CM87wk ≈ a 9 km box. Two letters (field) + two digits (square) + two optional letters (subsquare). 6-character locators are honored for your own position — important for VHF.
Bands
160, 80, 60, 40, 30, 20, 17, 15, 12, 10, 6, 2 meters. Each has a fixed color; All shows everything. (See §2 for how they behave.)
Modes
- CW — Morse code. Narrow, efficient, gets through when nothing else will.
- Voice (SSB) — talking (single-sideband phone).
- Digital — the computer generates and decodes tones (FT8, FT4, PSK, RTTY, JS8…). FT8 decodes signals far too weak to hear, which is why the map is often busiest in digital.
Where the spots come from
| Source | Feeds | What it is |
|---|---|---|
| PSK Reporter | Digital spots | A real-time firehose of automatic decodes |
| WSPRnet | Very weak beacons | Low-power propagation beacons, 2-min cycle |
| RBN | CW (+ some digital) | Automated “skimmer” receivers worldwide |
| DX Cluster | Any mode | Spots typed in by operators |
| APRS-IS | VHF paths | The APRS packet network (APRS view) |
Space weather (the numbers in Band Conditions)
- SFI — Solar Flux Index. Energy feeding the ionosphere; ~70 low, >150 excellent for the high bands.
- K — geomagnetic disturbance over 3 hours, 0–9. 0–2 quiet (good); 5+ = storm (HF suffers, aurora possible).
- A — geomagnetic activity over the last 24 hours: the average of the last eight 3-hour ap values, 0–400. 0–7 quiet, 30+ severe. It moves more slowly than K, so a storm during the night still shows in A after K has dropped.
- SN — sunspot number; higher generally means better high-band DX.
- X-ray (A/B/C/M/X) — solar-flare class. M/X flares drive the daytime D-RAP blackouts.
High SFI/sunspots = the high bands (10–20 m) light up for DX. Low K = calm, stable conditions. A big flare (M/X) = temporary daytime HF blackout, worst on the low bands.
MUF — Maximum Usable Frequency
The highest frequency that will still bounce back to Earth along a given path. If the MUF to a region is 21 MHz, then 15 m and below are likely open there and 12/10 m are not. In DXLook, MUF is measured, not modeled — worked out from the frequencies of real spots propagating now, refreshed as spots arrive. That makes it an observed “current ceiling,” different in kind from VOACAP’s statistical forecast.
D-RAP — D-Region Absorption Prediction
When a solar flare hits, the lowest ionospheric layer absorbs HF energy on the sunlit side — a partial or full blackout, worst on the low bands. The D-RAP layer shades those zones (NOAA), and DXLook factors the absorption into your personalized low-band ratings.
Perspective
Controls whose activity you see: Global (everything), My Call (spots involving your callsign), My Grid (activity from your square), Find (search a callsign, POTA park, or SOTA summit). Press Go after choosing My Call / My Grid / Find.
6The views
Switch views from the MAPS panel. Each follows the same shape — what it shows · when to use it · how to read it. Composite views (Reports+MUF, Reports+VOACAP) lay a live backdrop — the measured MUF, or the VOACAP forecast — under your Reports arcs.
Summary
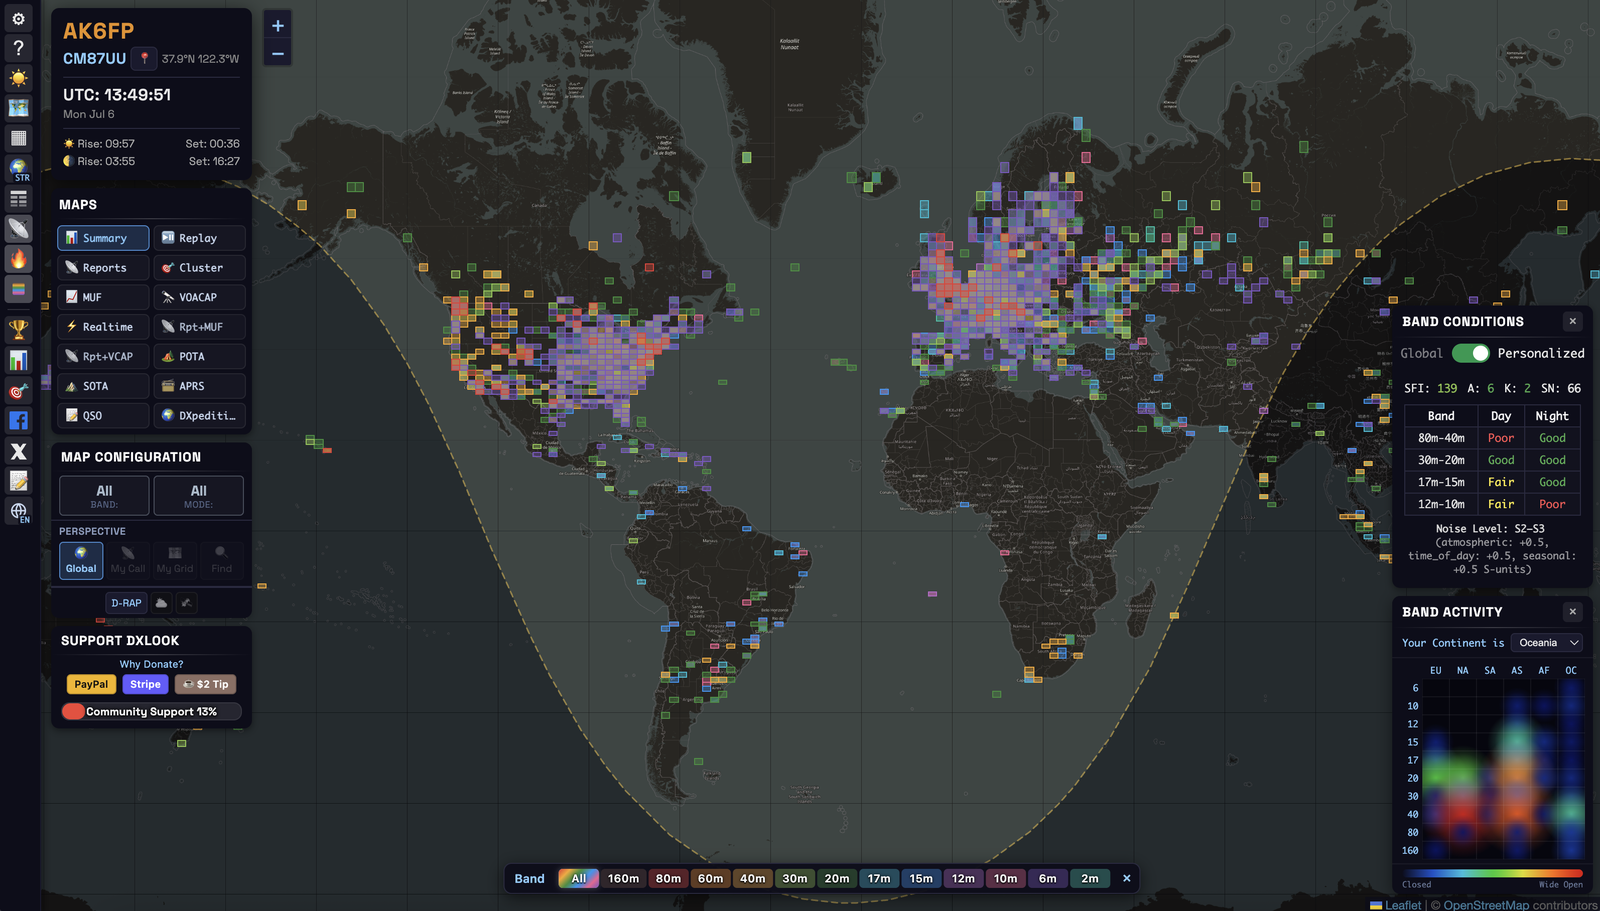
- Shows: a global overview — every 4-character grid square colored by its busiest band.
- When: to take the pulse of the whole world at a glance, no setup.
- Read it: a square’s color = the most active band there. Careful: Summary shows where a band is being used, not whether it’s open on your path to that place.
Reports
- Shows: 24-hour history for a callsign or grid, as great-circle arcs plus a sortable Spot Table.
- When: the core “where am I heard / who did I hear” view.
- Read it: each arc is one heard path; the origin square is your station. Direction: Sent / Rcvd / Both / QSOs.
Run My Call → Sent after calling CQ to literally watch where your signal is landing.
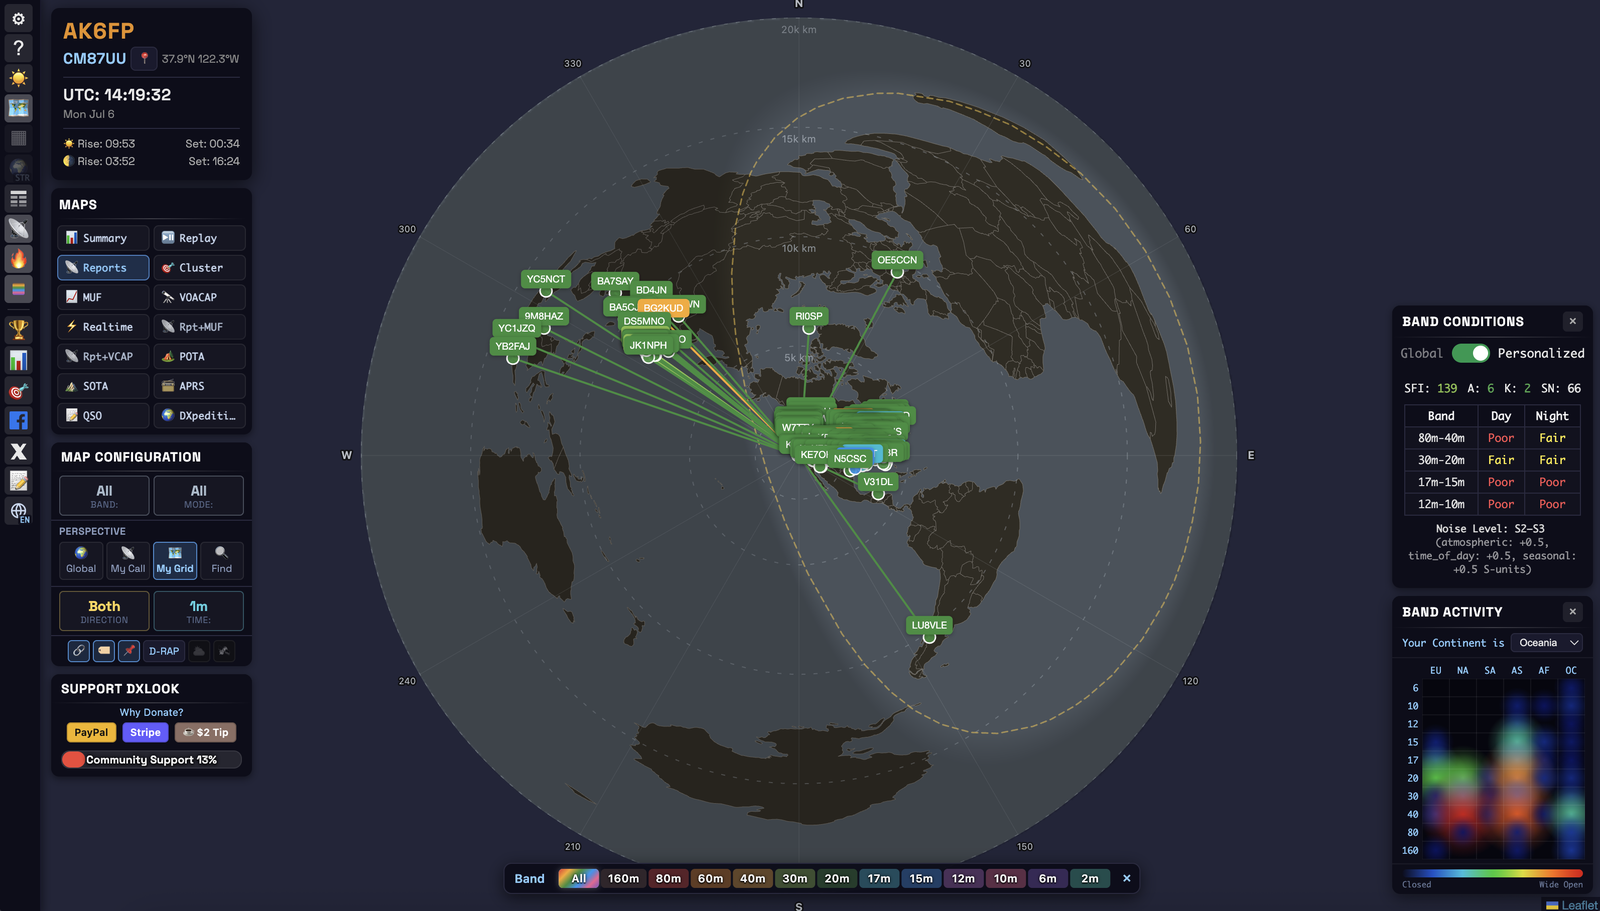
Reports + MUF / Reports + VOACAP
Reports + MUF overlays your arcs on the live, measured MUF — since both come from real spots, it shows whether your paths are reaching the band’s current ceiling. Reports + VOACAP overlays them on the forecast — the true prediction-vs-reality check, showing how optimistic the model is today.
Realtime
- Shows: a live feed from PSK Reporter — new spots appear within seconds, no refresh.
- When: to watch a band open in real time, or monitor your own call during a run.
Cluster · MUF · VOACAP
- Cluster: activity clustered around your grid — what’s reaching your area (bigger markers = more spots).
- MUF: regions colored by the highest usable band, from a MUF measured from real spots — “which bands are actually reaching where?”
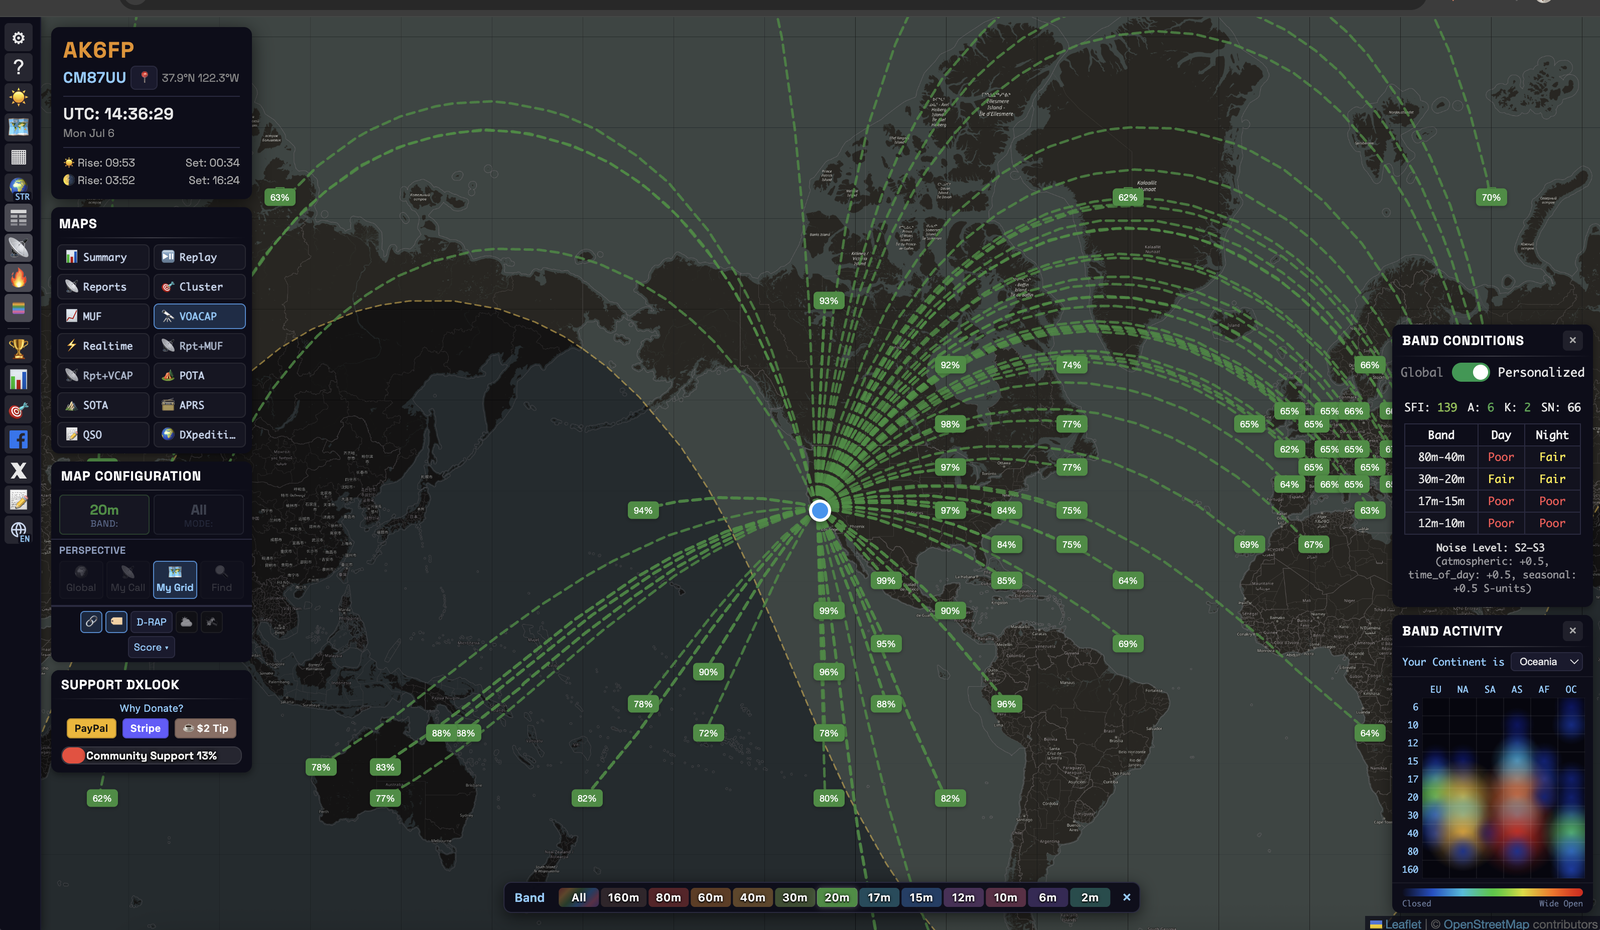
- VOACAP: theoretical predictions from your QTH; arc color = best band, thickness = quality. The Score filter shows only chosen tiers.
POTA · SOTA · APRS
- POTA / SOTA: live park / summit activations; click a marker to filter the table to it.
- APRS: VHF propagation contours from the packet network, colored by distance range.
Programs where operators activate parks or mountain summits and “hunters” try to contact them — a fun, low-pressure way to make contacts.
QSO — your logbook on the map (ADIF)
- Shows: your own logbook file plotted as arcs and markers, with the sun at both ends of each QSO.
- When: to see everywhere you’ve worked and which contacts rode the grey line; drop an ADIF file.
It has its own chapter: QSO: your logbook on the map.
The universal logbook file format exported by any logging program. Nothing is uploaded — it’s read in your browser.
DXpeditions · Replay
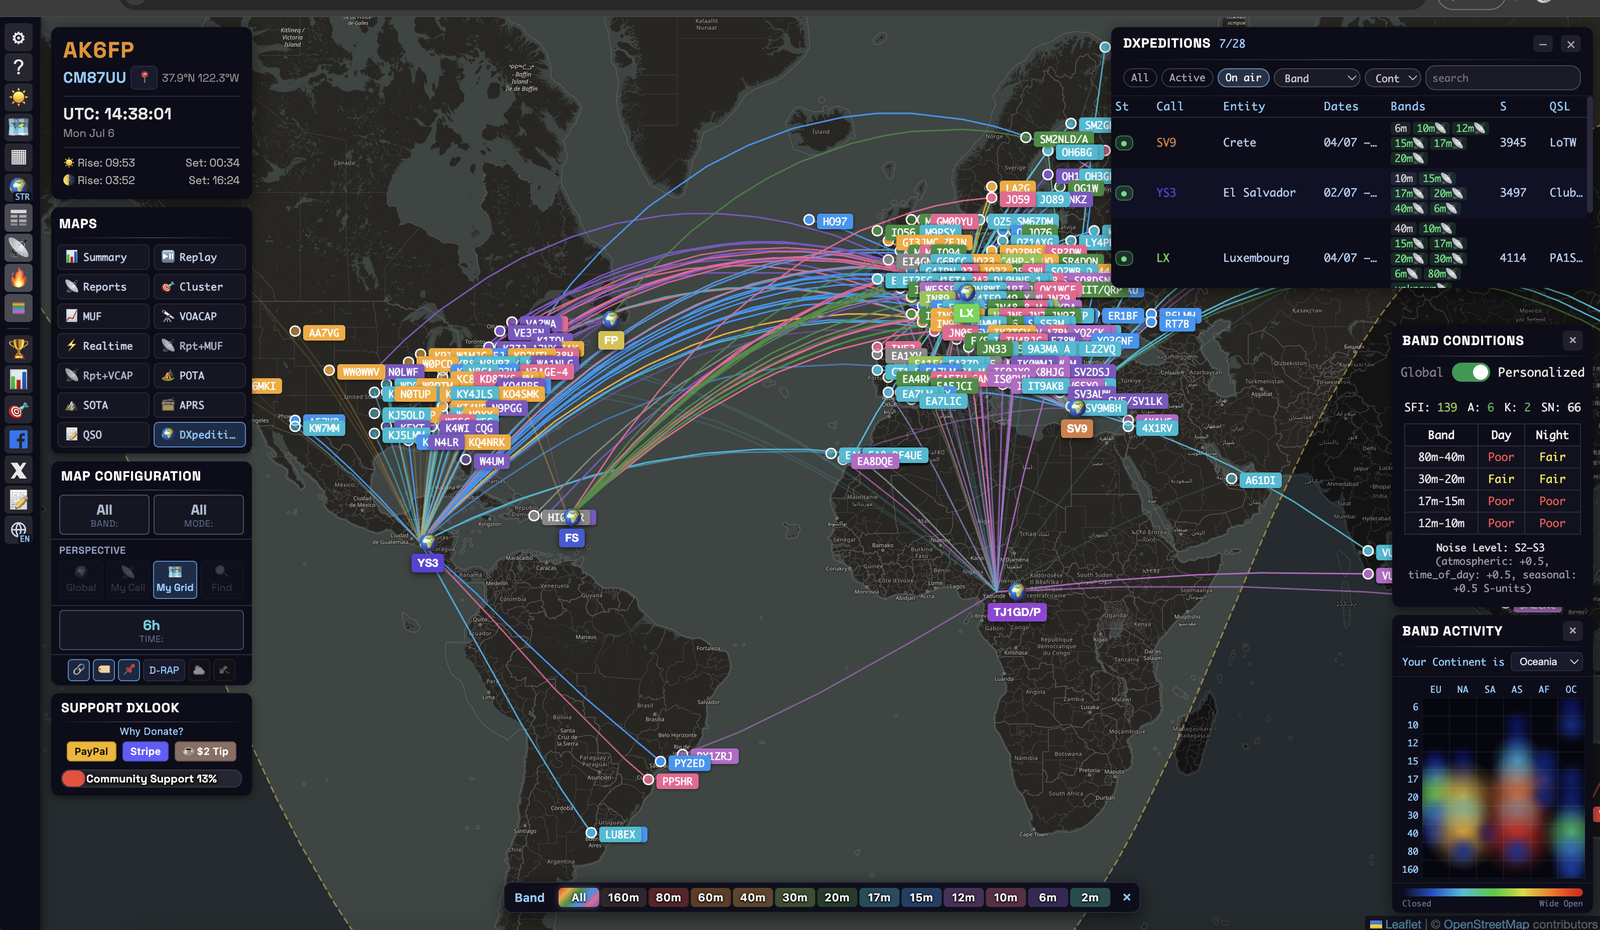
- DXpeditions: a live tracker of planned + on-air operations; select one for per-band VOACAP predictions from your QTH, checked against nearby spots.
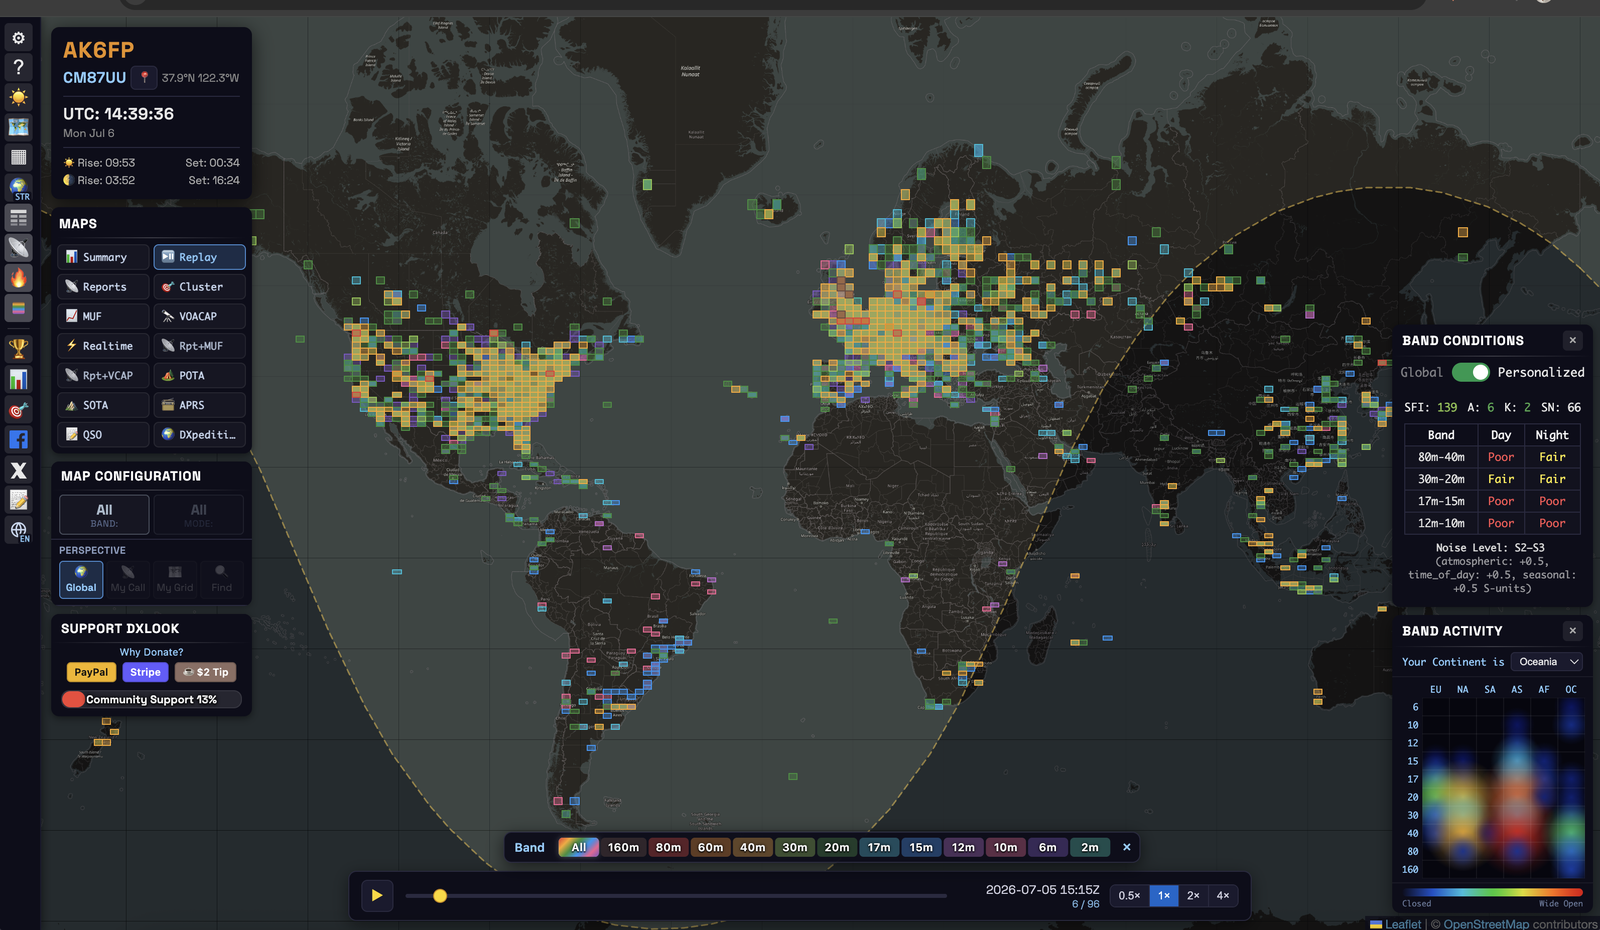
- Replay: an animated 24-hour playback in 15-minute steps — one of the best ways to learn how a band behaves.
Antenna
Compares your antenna with stations near you, using receivers that heard both, with WSPR, FT8 or FT4. It has its own chapter: Antenna comparison.
7Antenna comparison
The Antenna view answers a question most hams ask sooner or later: is my antenna any good, and in which directions? You need no test equipment and no second station. DXLook uses the reports that receivers all over the world already send to WSPRnet and PSK Reporter, and compares your signal with the signals of stations near you, as heard by the same receivers.
What it is for
- Find your weak directions. See where the world hears you worse than it hears the stations around you.
- Check a change. Raise the antenna, add radials, turn a dipole or try another antenna, then compare the new result with the old one.
- Compare with one station. Pick a nearby friend, for example someone with a beam, instead of the whole neighbourhood.
- Learn about your take-off angle. The result by distance shows whether you do better on short hops or on long DX.
Quick start
- Open Maps → Antenna (the 🧭 button).
- Type your callsign and press Go.
- Pick the mode you actually transmit: WSPR, FT8 or FT4.
- Leave the band on Busiest band the first time. DXLook picks the band with the most reports of you.
- Read the summary and the table What the data says. The charts below it show the same numbers.
WSPR or FT8? Use the mode you transmit
Both modes work the same way, with one big difference: WSPR messages include the transmit power and FT8/FT4 reports do not. That changes what each mode can tell you.
| WSPR | FT8 / FT4 | |
|---|---|---|
| You get | how much stronger or weaker you are than your neighbours, in dB | where you do better or worse than your own average, in dB |
| Period | the last 1, 3 or 7 days | the last 24 hours |
| Compared with | up to 20 stations within 300 km | the 10 busiest stations within 300 km |
| A pair is | one receiver, one 2-minute slot | one receiver, one 30-minute block |
| Best for | a real number: "is my antenna better than theirs?" | everyday FT8 operating: "where is my antenna weak?" |
Why don't I see my station?
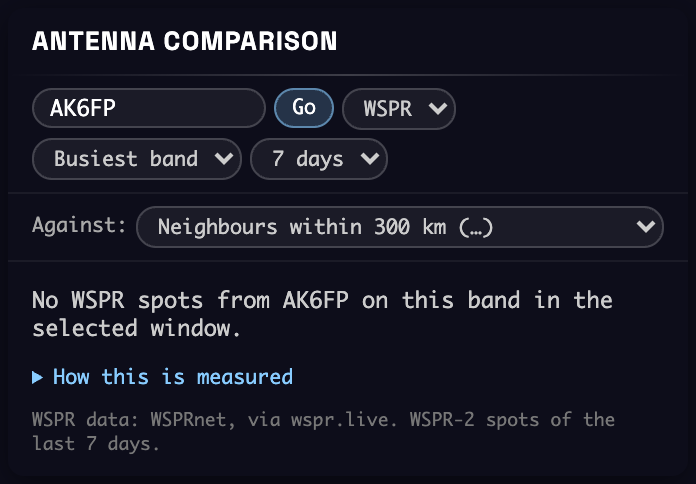
- "No WSPR spots from … in the selected window." No receiver reported you on WSPR on that band in the chosen days. Choose 7 days, try another band, or switch to FT8 or FT4 if that is what you operate. Only WSPR-2 counts; FST4W and WSPR-15 are not included.
- "No FT8 (or FT4) reports from … in the last 24 hours." No PSK Reporter receiver reported you in that mode on that band in the last day. You do not need to upload anything yourself: other stations' software reports what it decodes. Operate for a while and look again.
- "No other station within 300 km …" No neighbour was heard by enough of the same receivers. Try another band or another time of day, or choose Another callsign… under Against and type a station you know.
- Grey arcs and dashed slices. Fewer than 20 paired reports there. The view does not guess: keep transmitting and those directions fill in.
Reading the screen
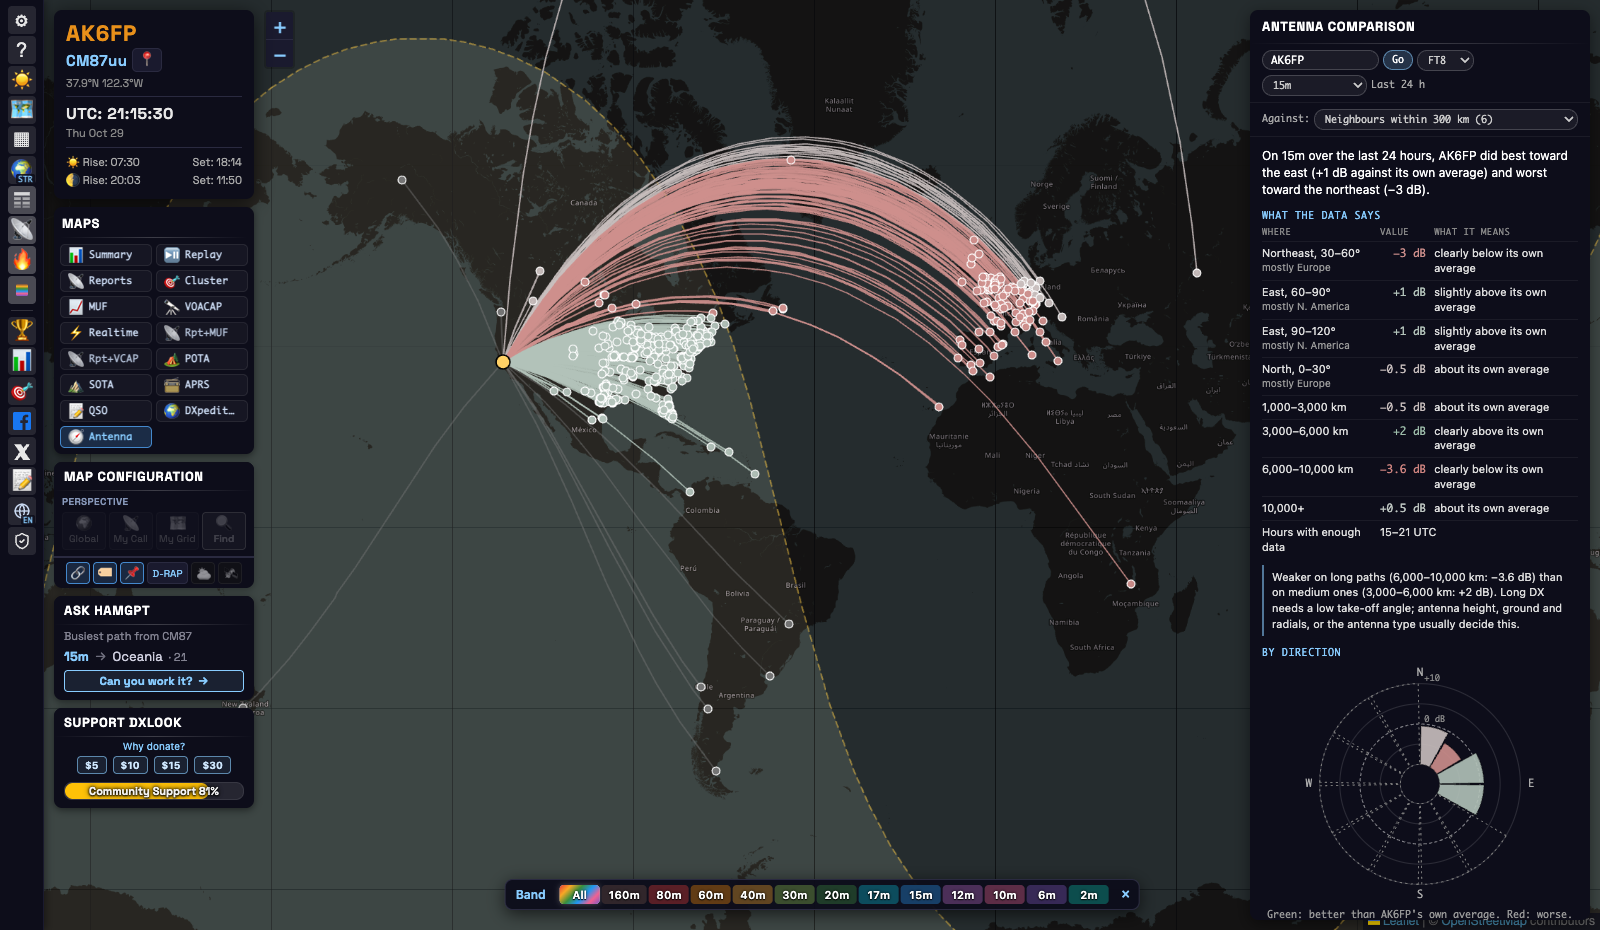
The map. The yellow dot is the station you typed. Each arc goes to a receiver that heard that station and a neighbour. Green means better, red worse, light grey about the same, dark grey not enough data. With WSPR every arc has its own value. With FT8 and FT4 an arc takes the colour of its direction, because one receiver rarely gives 20 pairs in a day.
The summary. One sentence with the main result. With WSPR it says how much stronger or weaker you were than your neighbours. With FT8 and FT4 it names your best and your worst direction against your own average.
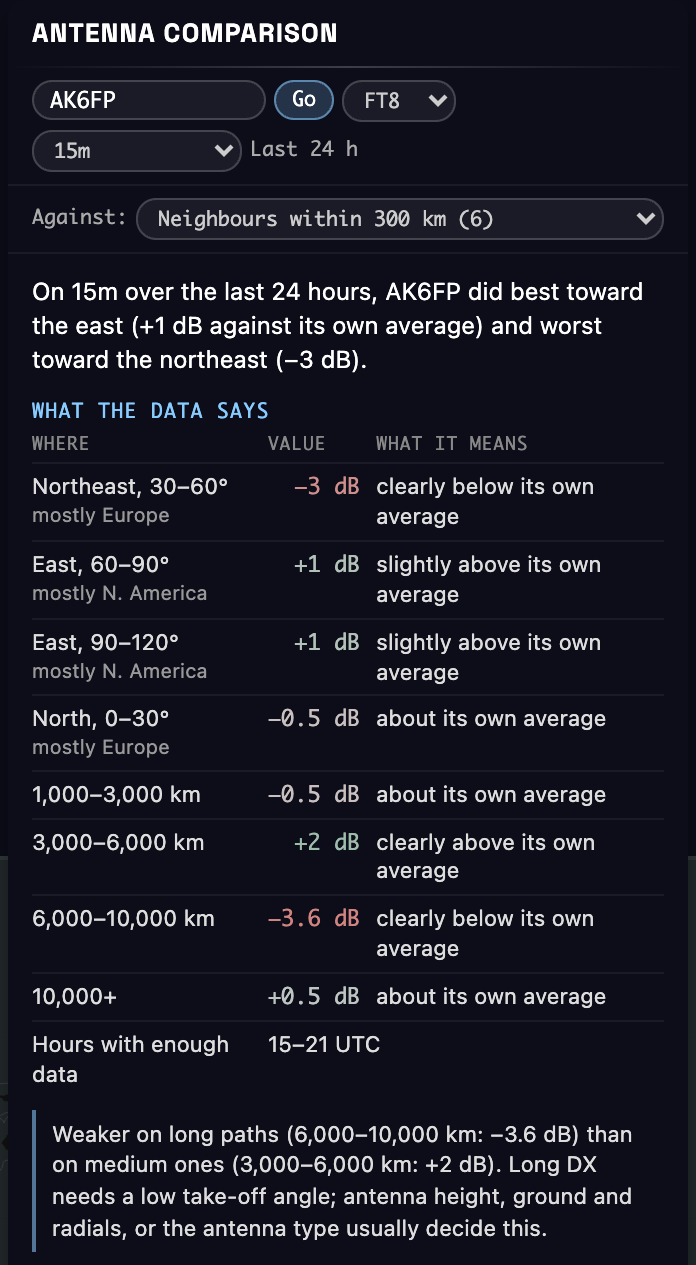
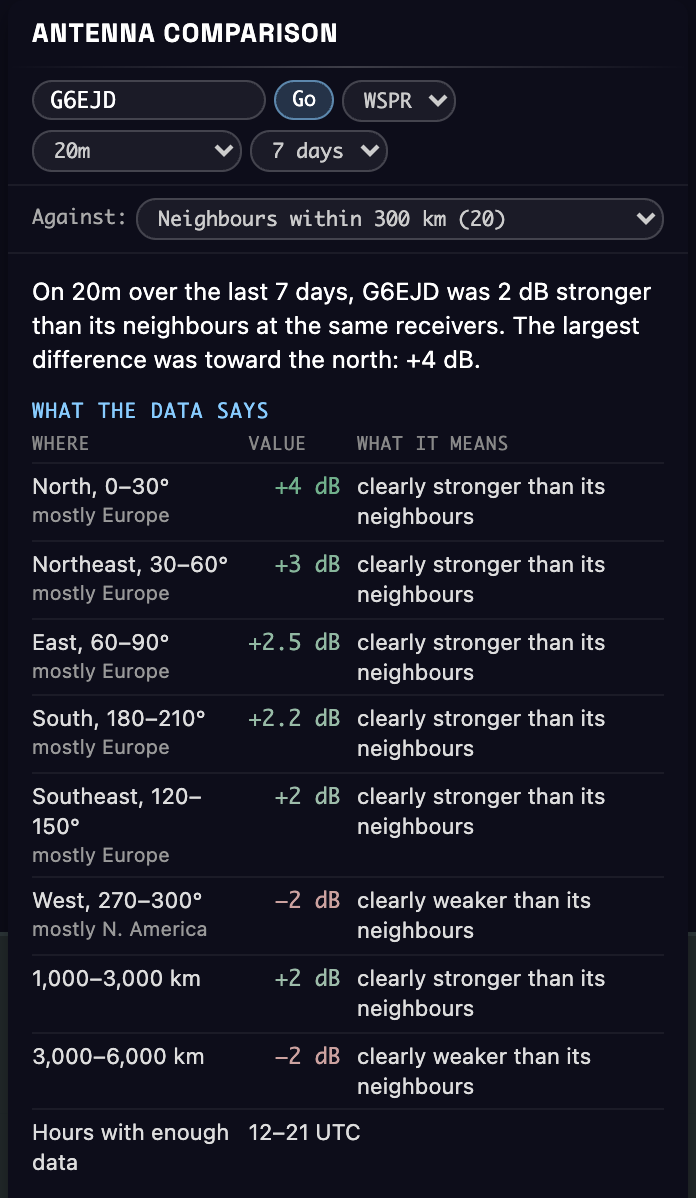
What the data says. The result in plain words. Each row is a direction or a distance with enough data, largest difference first:
- Where: the compass direction from your station, its 30° slice, and the continent most of those receivers are in ("mostly Europe").
- Value: the median difference, in dB.
- What it means: under 1 dB is "about" the same, 1 to 2 dB is "slightly", 2 dB or more is "clearly".
- The last row lists the hours (UTC) with enough data.
Under the table a note appears when a simple rule fits. There are three:
- Long paths: 6,000 km and beyond is at least 2 dB worse than the best shorter distance. Long DX needs a low take-off angle, so look at antenna height, ground and radials, or the antenna type.
- Dipole: two opposite directions are both at least 2 dB worse than the two directions at right angles to them. That is how a horizontal dipole behaves off its ends. Check which way yours points.
- Few directions: only two directions have enough data so far.
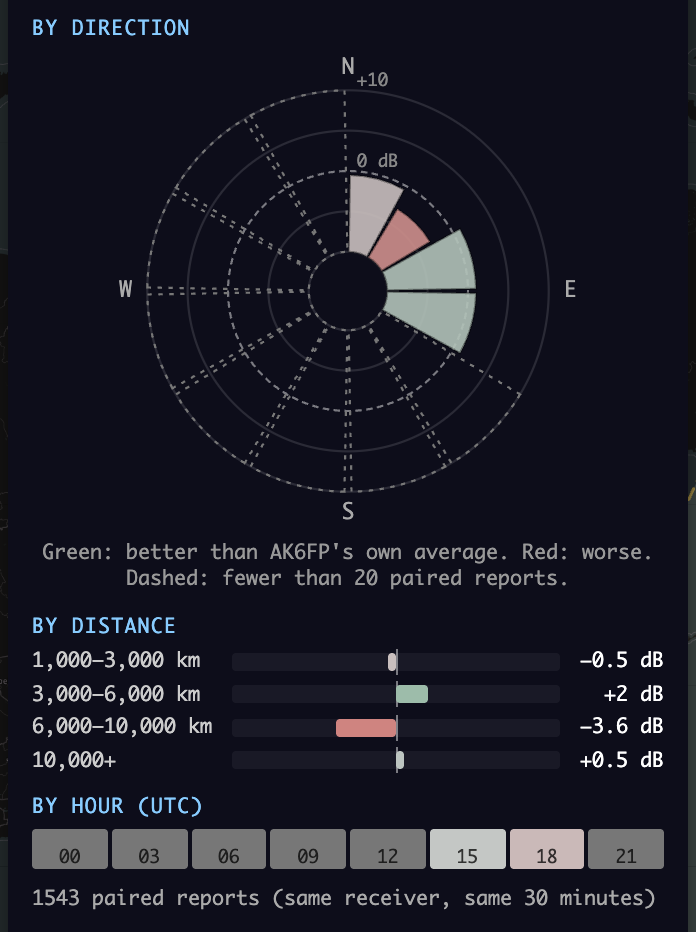
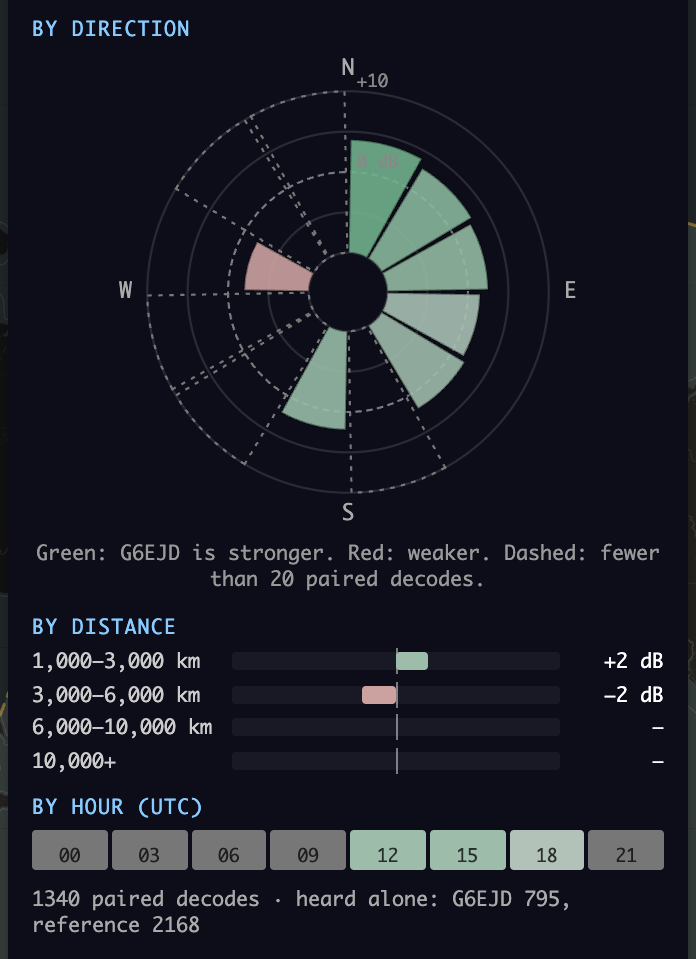
By direction. A compass rose seen from your station, north up, in 12 slices of 30°. The dashed ring is 0 dB. A slice that reaches past it is better, one that stays inside it is worse; the outer ring is +10 dB. A dashed outline means fewer than 20 pairs.
By distance. A bar to the right is better, to the left worse. Distance is a rough guide to take-off angle: receivers 1,000 to 3,000 km away are reached at higher angles, and those beyond 6,000 km need low angles.
By hour (UTC). Eight blocks of 3 hours, coloured the same way. Grey blocks have fewer than 20 pairs, usually because you were not on the air then.
Against. By default the reference is your neighbourhood: the median of several stations within 300 km. You can also pick one neighbour from the list, which is sorted by how many receivers you share, or type any callsign.
The counts line. How many pairs the result is built on. With WSPR it also shows how often only one of the two stations was decoded ("heard alone"): that is where one of them dropped below WSPR's limit of about −30 dB. FT8 and FT4 leave it out, because a receiver reports a station only every 20 to 60 minutes, so a missing report says nothing about signal strength.
Two examples
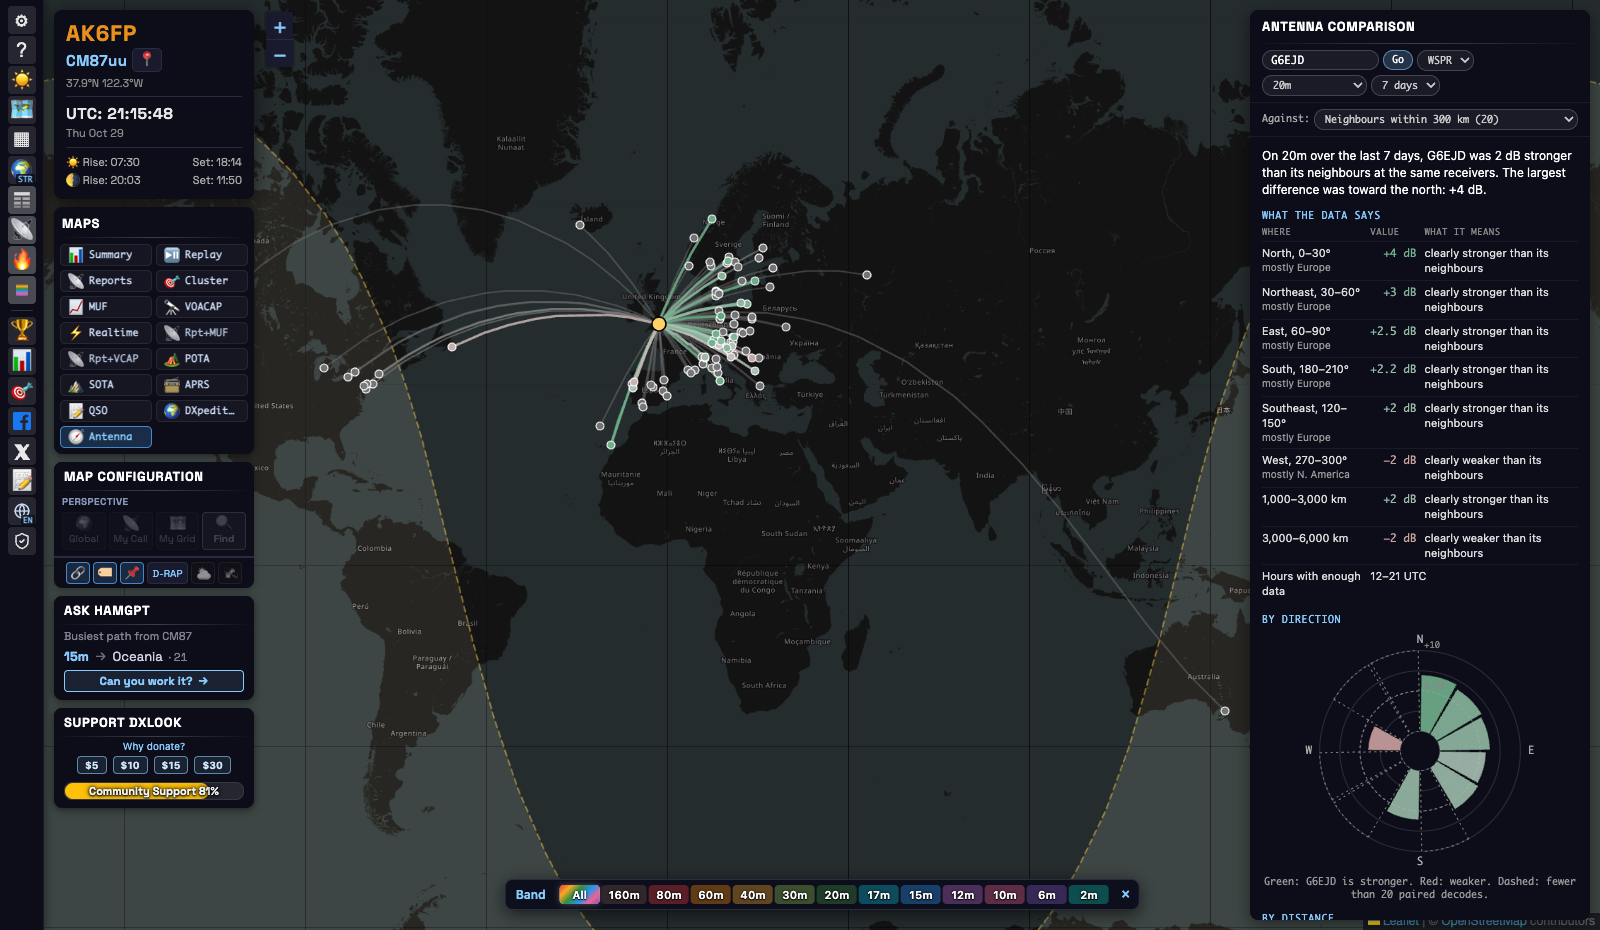
WSPR: G6EJD, 20 m, last 7 days. The summary says G6EJD was 2 dB stronger than its neighbours. The table shows where: +4 dB to the north (Scandinavia) and +2 to +3 dB across Europe, but −2 dB to the west, toward North America. By distance it is +2 dB at 1,000 to 3,000 km and −2 dB at 3,000 to 6,000 km. In short: a good antenna for Europe, a little weaker than its neighbours across the Atlantic. Because WSPR includes the transmit power, these are real differences between the stations.
FT8: AK6FP, 15 m, last 24 hours (the first picture in this chapter). FT8 cannot say whether AK6FP is stronger than its neighbours, only how its directions compare with each other. The table shows −3 dB to the northeast (mostly Europe) and +1 dB to the east (North America); −3.6 dB beyond 6,000 km and +2 dB at 3,000 to 6,000 km. The long-path note appears: this station does well at medium distances and loses on long DX, which points to a higher take-off angle than its neighbours have. Things to try: a higher antenna, better ground or radials, or an antenna with a lower angle. If it is a dipole, check that Europe is not off one of its ends.
How it works
The same receiver hears both. When one receiver hears you and a station near you at almost the same time, most things are the same for both signals: the receiver, its antenna, its noise, and most of the path through the ionosphere. What differs is the two transmitting stations: antenna, height, feedline, ground and surroundings, and power. Comparing the two signal reports at that receiver, many times over, measures that difference.
Why neighbours, and why 300 km. Stations close to you take nearly the same path to a distant receiver. 300 km is close enough for that and wide enough to find neighbours in most places. The neighbourhood is the median of several stations, so one unusual antenna nearby does not decide the result.
Why receivers closer than 1,000 km are left out. For a nearby receiver, the up to 300 km between you and a neighbour changes the path a lot. For a distant one it hardly matters.
WSPR: the power is taken out. Every WSPR message includes the power the station sends, in dBm. DXLook subtracts it from the signal report, for you and for the neighbour, and compares what is left. Only pairs decoded by the same receiver in the same 2-minute slot count. That is why WSPR can say "2 dB stronger than your neighbours".
FT8 and FT4: only the pattern. FT8 and FT4 reports do not include power, so a neighbour running 100 W looks 10 dB better than one running 10 W, whatever their antennas. DXLook first finds each neighbour's usual difference to you and shifts that neighbour by it. This removes the power and the average antenna gain of both stations. What is left is how each direction, distance and hour compares with your own average. Pairs are made per receiver and 30-minute block, because PSK Reporter clients report the same station to the same receiver only every 20 to 60 minutes.
Medians and the 20-pair rule. One report can be 10 dB off because of fading. The median of many reports is steady, so a direction, a distance or an hour needs at least 20 pairs before it gets a value.
What it cannot tell you.
- It is your pattern as the world hears it, not a lab measurement: ground, buildings and nearby objects are part of it.
- Only directions with receivers count. Oceans and empty regions often stay grey.
- With FT8 and FT4 large differences come out smaller than they are. Checked against WSPR, a direction 8 dB down showed as about 6 dB down.
- If you change power during the period, or the power set in your WSPR software is wrong, the result moves.
- Propagation changes with band, hour and season. Compare like with like: same band, similar hours.
The data we keep and use
| WSPR | FT8 / FT4 | |
|---|---|---|
| Source | WSPRnet, through wspr.live, fetched every 10 minutes | PSK Reporter, received live over MQTT |
| Kept by DXLook | 7 days of WSPR-2 spots | 24 hours of reports, and a list of FT8/FT4 stations with their positions for 48 hours |
| Used for the comparison | the period you choose: 1, 3 or 7 days | the last 24 hours |
| A result is reused for | 1 hour | 30 minutes |
If your station was not found, DXLook looks again after 10 minutes. Opening the page never sends a request to WSPRnet, wspr.live or PSK Reporter: everything is read from DXLook's own copy of the data.
Tips
- Before and after. Note the result, make your change, and look again: the next day with FT8, or with WSPR after a day using the 1-day period. Keep the band and the power the same.
- Two antennas at home. Run the second antenna under another callsign at the same time, then pick that callsign under Against.
- Use your busiest band and hours. More reports mean fewer grey areas.
- One neighbour or the neighbourhood. The neighbourhood gives the steadiest answer. One station is useful when you know what antenna it uses.
8QSO: your logbook on the map
Load the ADIF file your logging program exports, and every QSO becomes an arc from where you were to the station you worked. The file is read in your browser and never uploaded. Use it to see where you have been heard and worked, which bands took you where, and where the sun was at both ends of each contact.
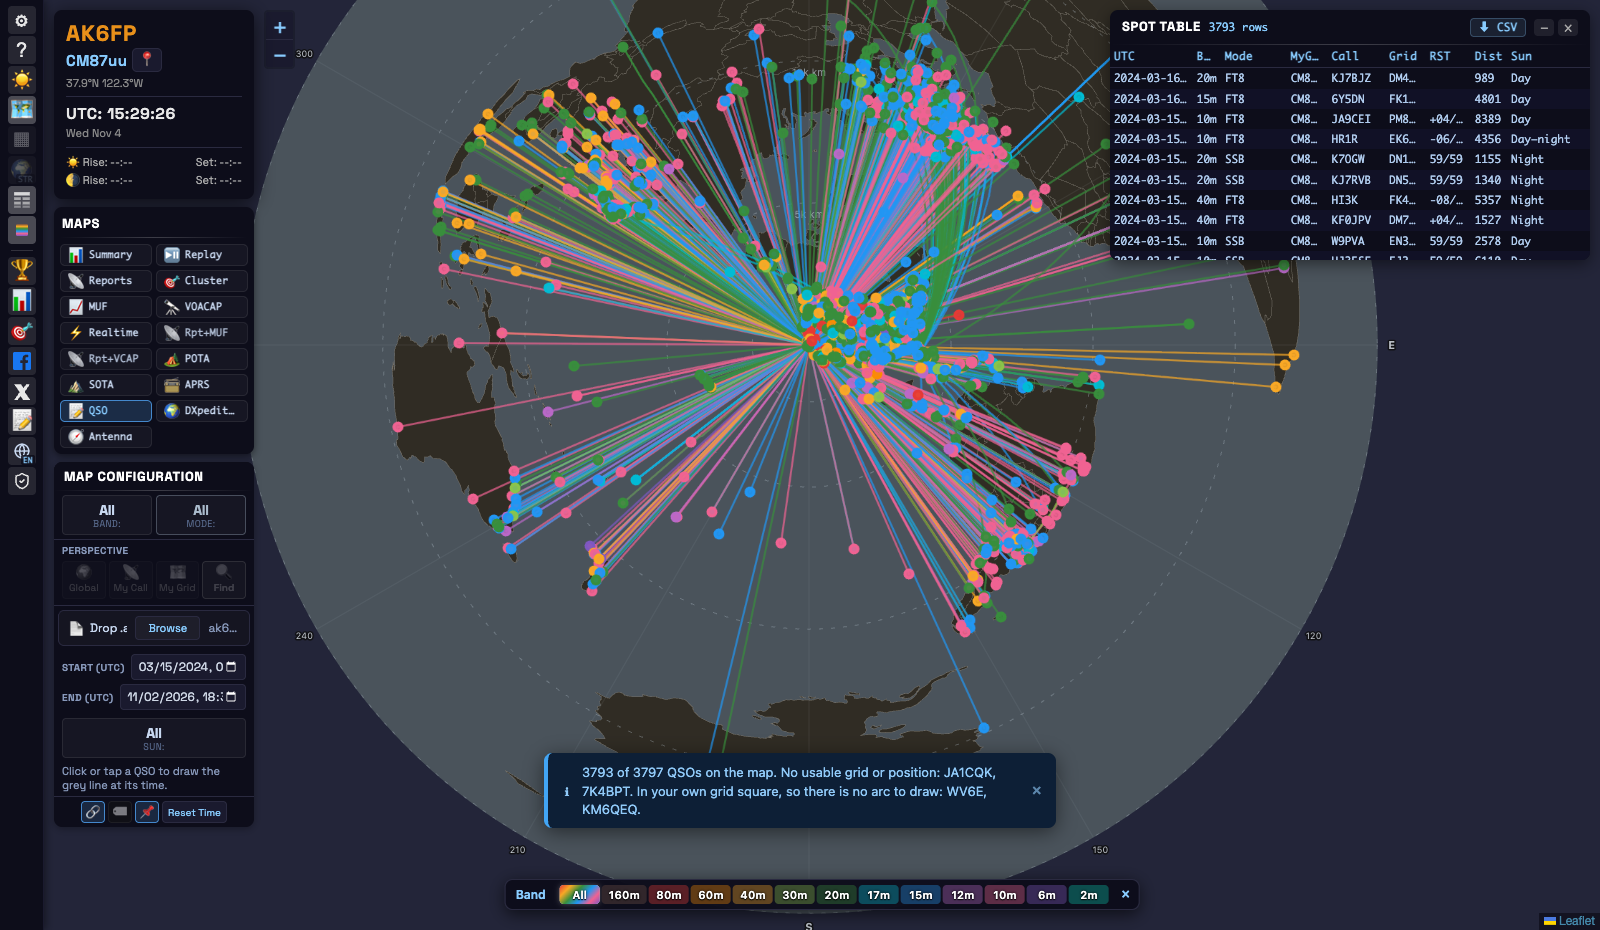
Quick start
- Open Maps → QSO.
- Export an ADIF file (
.adi) from your logging program or from QRZ.com or LoTW. WSJT-X keeps one already:wsjtx_log.adi. - Drop the file on Drop .adi, or press Browse.
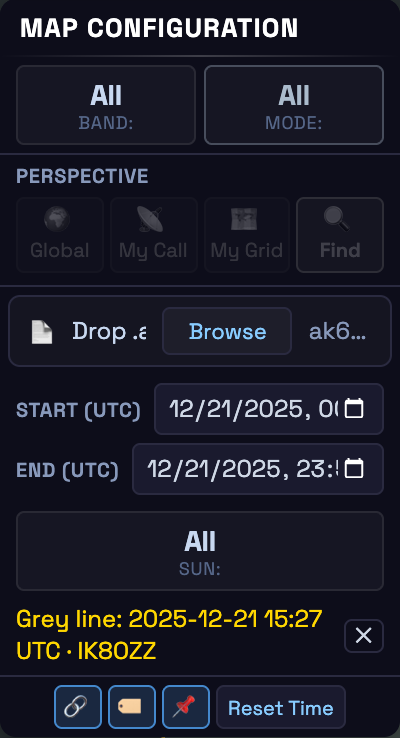
- Narrow it down with Band, Mode, Start (UTC), End (UTC) and Sun. Reset Time brings back the whole file.
- Click a QSO to draw the grey line at the time you made it.
All times are UTC
ADIF stores the date and time of a QSO in UTC, and DXLook reads them that way. Start (UTC), End (UTC), the tooltip and the list all show UTC; your computer’s time zone plays no part. The browser shows the two date fields in its own format, but the values in them are UTC. End includes its whole minute, so a QSO logged at 12:34:56 is inside a range that ends at 12:34. A QSO without a date shows only while the range covers the whole file.
The grey line of a QSO
The other views draw the grey line for the current time. In the QSO view that line would mean nothing, because your contacts were made at other times, so nothing is drawn until you pick a QSO:
- click its arc or its marker (tap it on a phone), or click its row in the list;
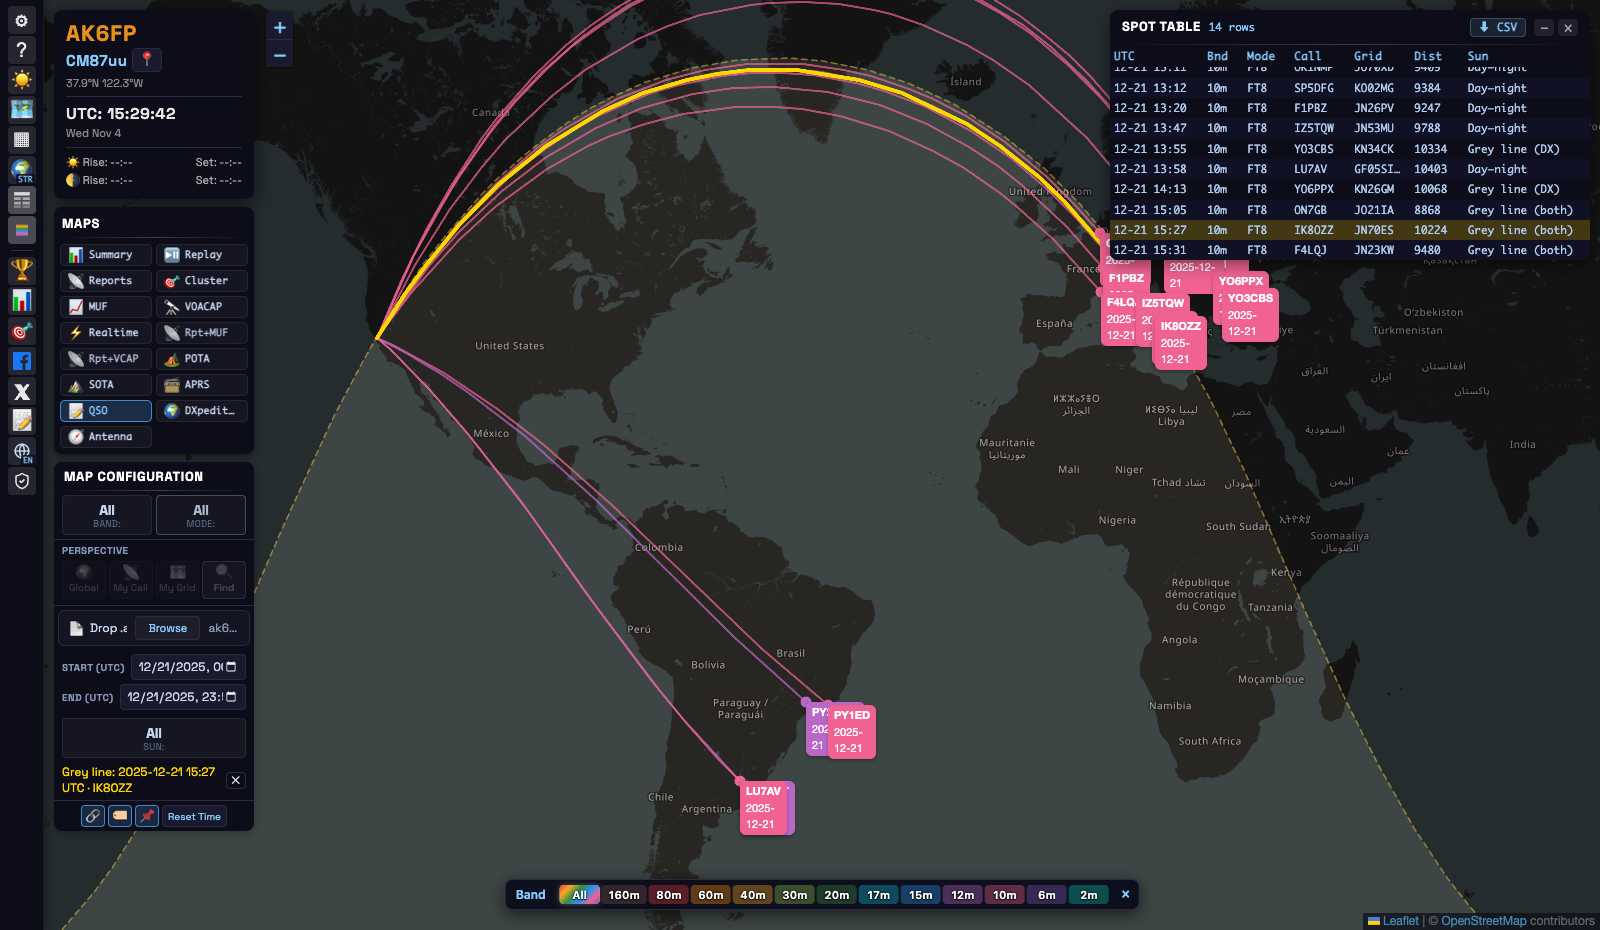
- the map draws the grey line and the night shading for the moment of that QSO, and the arc turns gold;
- the line under the controls says which QSO it is for, for example Grey line: 2025-12-21 15:27 UTC · IK8OZZ;
- the ✕ next to it removes the line. So does a filter that hides that QSO.
A QSO logged without a time has no moment to draw, so it cannot be picked.
Where the sun was at both ends
Hover over a QSO (tap it on a phone) and the tooltip shows, for your end and for the other station:
- the height of the sun in degrees: above the horizon (+) or below it (−);
- how far that end was from the nearest sunrise or sunset, for example sunrise 1 min ago or sunset in 6 min. Near the poles it can say polar day or polar night instead.
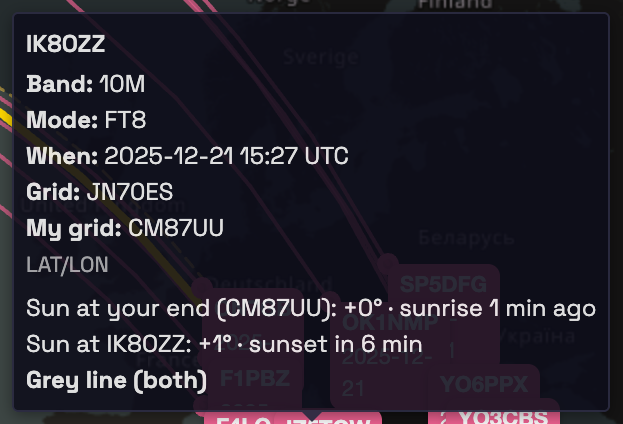
Each end is then one of three states:
| State | Sun height |
|---|---|
| Day | more than 6° above the horizon |
| Grey line | between 6° below and 6° above the horizon. At mid-latitudes that is about half an hour either side of sunrise or sunset. |
| Night | more than 6° below the horizon |
And the QSO gets a label from the two ends together, shown in bold in the tooltip and in the Sun column of the list:
- Grey line (both): both ends on the grey line, the classic sunrise-to-sunset path.
- Grey line (you) or Grey line (DX): only one end on it.
- Day: daylight at both ends. Night: dark at both ends.
- Day–night: daylight at one end and night at the other.
The Sun filter
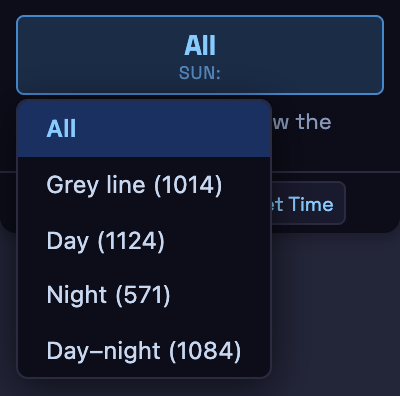
Sun keeps only the QSOs in one category: Grey line (all three grey-line labels), Day, Night or Day–night. The number next to each option is how many QSOs the map shows if you pick it, with the band, mode and time range you have set. QSOs without a time appear only under All. The filter does not appear for a file that has no times at all.
The QSO list
On a computer, the list button in the left toolbar opens the QSO list: time (UTC), band, mode, call, grid, RST, distance and the sun label. Click a column to sort by it. Click a row to select that QSO: its arc turns gold and the grey line is drawn for its time. A MyGrd column appears when the log was made from more than one place. To save space the list leaves out the year when all the QSOs shown are from the same year, and the seconds; CSV exports the full date and time.
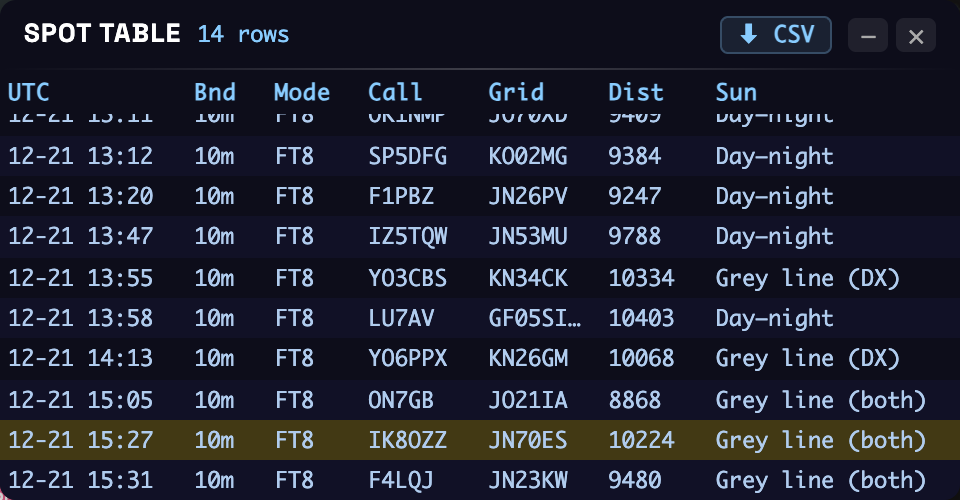
An example: 10 m on the winter solstice
On 21 December 2025, the winter solstice, AK6FP worked Europe on 10 m FT8 from California before sunrise. Set Start and End to that day and the list shows how the sun moved. From 13:08 to 13:47 UTC it was night in California and daytime in Italy, the Czech Republic, Poland and France: those QSOs are Day–night. At 13:55 and 14:13 the sun was low over Romania: Grey line (DX). The QSOs from 15:05 to 15:31, with Belgium, Italy and France, are Grey line (both): the sun was rising in California and setting in Europe. Pick IK8OZZ at 15:27 and the grey line runs through both ends of its arc. The QSOs after that, from 15:33, are with Brazil and Argentina, where the sun was already high.
QSOs left off the map
When some QSOs cannot be drawn, a notice at the bottom of the map names them and says why:
- No usable grid or position. The QSO has no grid and no latitude/longitude, or only QRZ.com’s placeholder for an unknown location: grid
AA00aa, at the South Pole. Add the grid in your logbook and load the file again. - In your own grid square. The other station was in the same square as you, often a local VHF contact, so there is no arc to draw.
Where the positions come from. The other station is placed at its GRIDSQUARE, and you at the MY_GRIDSQUARE of that QSO, so a portable or POTA log shows each QSO from where you actually were. Many logging programs also fill in latitude and longitude from QRZ.com profiles, which often put a station at its home address or simply somewhere else: in one real log, 201 of 3,765 such positions fell outside the QSO’s own grid square. So DXLook uses latitude and longitude only when there is no grid, or when they fall inside the grid’s square and make it more precise. A QSO with a frequency and no band gets its band from the frequency.
Tips
- Find your grey-line contacts. Set Sun to Grey line and then pick a band. On 40, 80 and 160 m this is where long DX at sunrise and sunset shows up.
- Look back at a contest. Set Start and End to the contest weekend and go band by band.
- Headings from home. With your grid set, the azimuthal map puts you in the centre: each arc is then a straight line along the heading you would point a beam.
- A busy map. Turn off the labels (🏷 in the controls) when the log has hundreds of QSOs.
9Panels & widgets
Band Conditions (space weather)
The right-hand widget answering “how are the bands for me right now.” Global vs Personalized (needs a grid) factors your geomagnetic latitude, day/night, D-layer absorption and aurora risk. Shows the SFI · A · K · SN indices, a band table rated day/night (good/fair/poor), plus noise and aurora when relevant.
Band Activity (heatmap)
A live band × continent grid of how much activity there is, counting spots where either end is in the continent you pick. Dark → red = quiet → very busy. Careful: “busy” is a strong hint of an opening, but it’s also shaped by how many operators are on — it’s about activity, not a guaranteed path from your exact QTH.
Station Info · Spot Table
Station Info (top-left) holds your callsign and grid (click to edit), lat/lon, a Find-My-Grid button, the UTC clock, and sun/moon times. The Spot Table (toggle ≡) is a sortable table for Reports/POTA/SOTA with CSV export.
Hams worldwide use Coordinated Universal Time so everyone agrees on “when,” regardless of time zone.
Map Configuration · Display toggles & Layers
The control panel holds Band & Mode, Perspective, per-view time/direction controls, plus:
- Show / Hide arcs — the path lines (hide to declutter).
- Show / Hide labels — the callsign/time tags.
- Pins ↔ grid squares — draw destinations as pins or as their grid-square outlines.
- D-RAP · NA Weather · Satellites — overlay layers that persist across views (Weather is off in azimuthal).
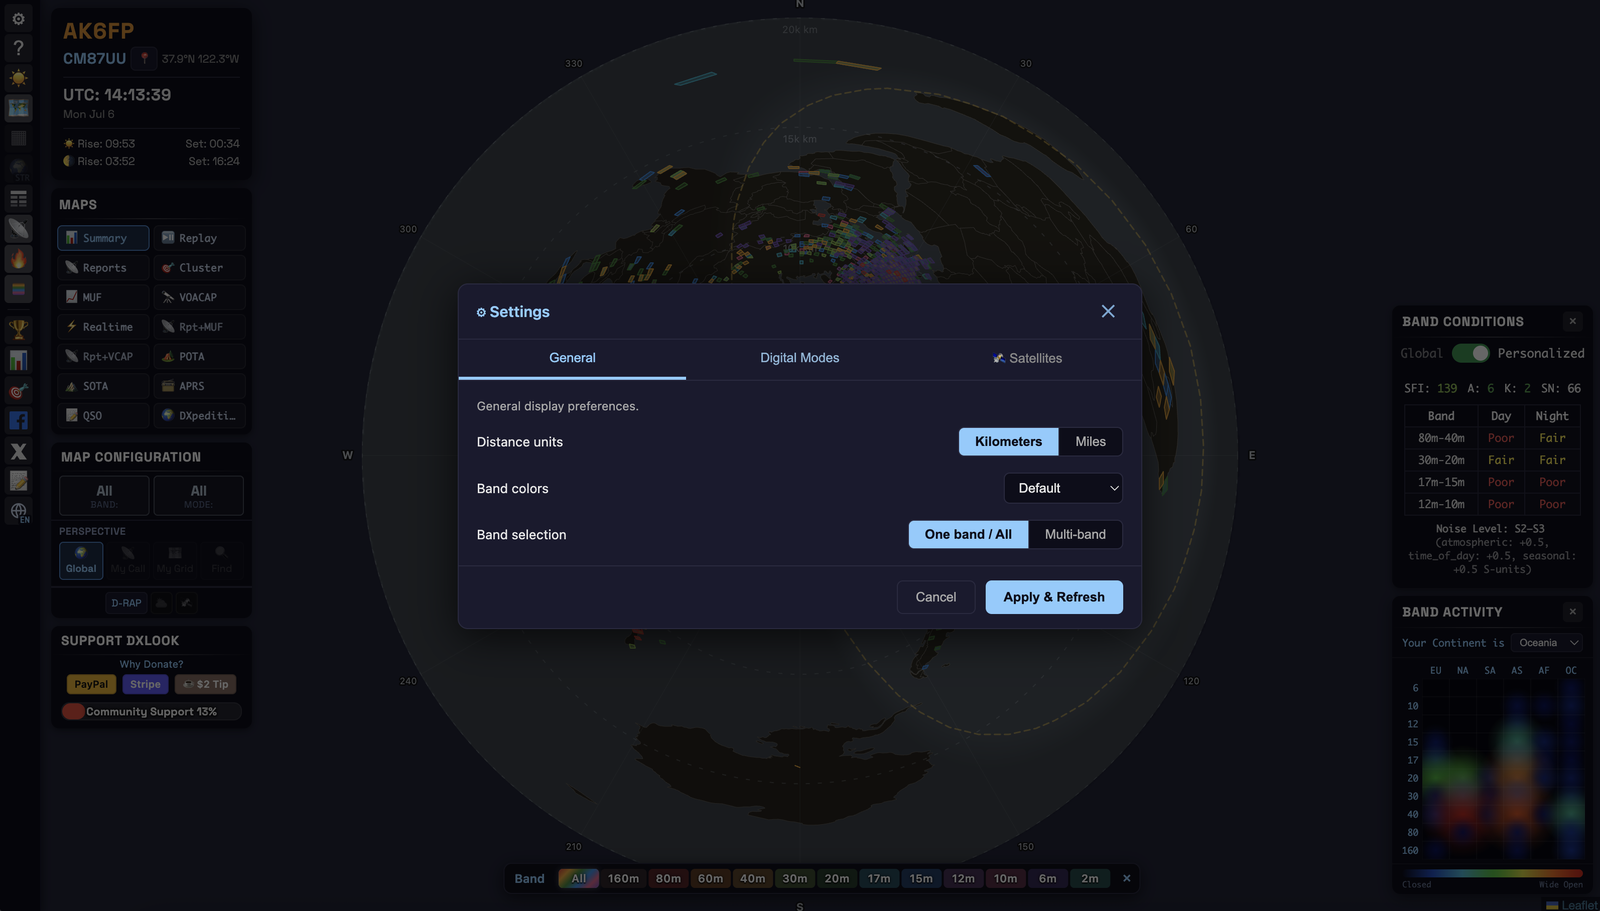
Settings
Three tabs (⚙). Changes apply on Apply & Refresh.
- General — distance units (km/mi); band colors (default or high-contrast for color-vision deficiency); band selection (One band / All vs Multi-band).
- Digital Modes — choose exactly which digital sub-modes count as “Digital” (FT8, FT4, PSK, RTTY, JS8, Q65…). Zero in on one, or hide the firehose.
- Satellites — enable the layer, show track lines and footprints, opacity, and pick from 200+ amateur satellites.
10The left toolbar
| Icon | Opens / does |
|---|---|
| ⚙ | Settings — units, colors, digital modes, satellites |
| ? | Help / this guide |
| ☀️ / 🌙 | Dark / light mode |
| 🗺 | Projection — Flat ↔ Azimuthal (needs a grid) |
| ▦ | Grid overlay — Maidenhead lines + codes (flat map) |
| 🌍 | Basemap — Carto Atlas · Natural Geo · Terrain · Satellite |
| ≡ | Spot Table show / hide (desktop) |
| 📡 | Band Conditions widget |
| 🔥 | Band Activity widget |
| 🎨 | Band Legend |
| 🏆 / 📊 / 🎯 | Events · Statistics · Find My Grid |
| 🌐 | Language — EN · ES · DE · RU · ZH · JA |
11Tips & workflows
- “Am I getting out on 20 m?” → Reports · My Call · 20 m · azimuthal → read your footprint and beam headings.
- “Which way do I point the beam?” → azimuthal → the straight-line direction from center to the DX is your heading.
- “Is the path open before I call?” → MUF or VOACAP from your grid → check the target region, then confirm with Reports.
- “Catch an opening live.” → Realtime · your band.
- “Work a new band as a beginner.” → Band Conditions (Personalized) shows which band is rated best for your location and time.
- “Hunt parks/summits.” → POTA or SOTA → click activations → sort the table by distance.
- “See my whole logbook.” → QSO → drop your ADIF file.
- “Which of my QSOs rode the grey line?” → QSO → Sun: Grey line → pick a band.
12FAQ
Do I need an account or a license? No account. You don’t need a license to look — DXLook is a great way to explore the hobby. You do need a license to transmit.
Is my data private? Your callsign and grid live only in your browser; ADIF logs are read locally and never uploaded. See the Privacy Policy.
Why is the azimuthal button greyed out? Set your grid first — it needs a center point.
Why do some paths look curved? Great-circle paths are straight only from the projection’s center (your station in azimuthal); paths between two other stations are genuinely curved.
Why is HF “dead” in the middle of the day? Possibly a solar flare — check the D-RAP layer and the X-ray class. Or the band is simply above the current MUF for the path you want.
Why don't I appear in the Antenna view? Receivers must have heard you recently in the mode you picked: WSPR in the last 1 to 7 days, FT8/FT4 in the last 24 hours. If you operate FT8 and not WSPR, switch the mode to FT8. More in Antenna comparison.
Why is there no grey line in the QSO view? Your QSOs were made at other times than now, so the view draws the grey line only for the QSO you select, at the UTC time it was made. Click an arc, a marker or a row of the list. More in QSO: your logbook on the map.
13Glossary
ADIF — standard logbook file format. DX — a distant station. DXpedition — a trip to activate a rare location. Great circle — the shortest path over the globe. Grey line — the day/night twilight boundary. Grid / Maidenhead — a location code (e.g. CM87). HF / VHF — 3–30 MHz (DX bands) / 50 MHz+ (mostly local). Ionosphere — the layer that reflects HF signals. MUF — Maximum Usable Frequency for a path. QSO — a two-way contact. QTH — your station’s location. SFI / K / A / SN — space-weather indices (§5). SNR — signal-to-noise ratio (dB); decode strength. Spot — an automatic “heard” report. VOACAP — a statistical propagation forecast model.
14How often everything updates
DXLook refreshes itself — you never need to reload the page. How often depends on which view you are in and on the time window you picked. Short windows refresh quickly, because that is where a minute actually matters; a 24-hour view barely changes from one minute to the next, so it takes its time.
The views
| What you are looking at | Redraws |
|---|---|
| Reports — My Call, or any callsign | every 2 minutes, whatever time window you choose |
| Reports — My Grid | 30 s on 1 m · 1 min on 5–10 m · 3 min on 15–30 m · 15 min on 1 h |
| Reports — Global | 30 s on 1 m · 1 min on 5 m |
| Reports + MUF · Reports + VOACAP | at least every 2½ minutes, so the backdrop never falls behind |
| Summary · Cluster · MUF · VOACAP · POTA · SOTA | every 2½ minutes |
| Realtime | live — spots appear within seconds of being reported |
| APRS | every minute |
| DXpeditions | follows your window — 15 s on 1 m, up to 20 min on 24 h |
| Antenna | every 30 minutes — WSPR compares up to 7 days of spots and FT8/FT4 the last 24 hours, so it changes slowly |
| Replay | a fixed 24-hour recording — you scrub through it yourself |
| QSO | your ADIF file, read on your own computer — nothing to refresh. The grey line is drawn for the QSO you select, not for now. |
Panels, widgets and layers
| Panel / layer | Updates |
|---|---|
| Band Conditions (SFI · A · K · SN and the band table) | every 10 minutes |
| Band Activity heatmap | every 30 minutes |
| D-RAP absorption layer | every 10 minutes |
| Satellites | positions every 5 seconds |
| Day / night line (grey line) | every 5 minutes; in the QSO view, the time of the selected QSO |
| Station Info — sunrise, sunset, moon | every 5 minutes (the UTC clock ticks every second) |
Three things worth knowing
- Watching your own callsign is always quick. Whenever the perspective is a callsign — My Call included — the map comes back every 2 minutes even on a 24-hour window, because you want to see the QSO you just made. On the long windows DXLook also fetches the last 5 minutes separately and merges it in, so a contact made a moment ago shows up without waiting for the whole 24-hour picture to be rebuilt.
- A hidden tab pauses. If DXLook is in a background tab or another app is in front, the countdown is skipped — it saves your battery and our server. The moment you come back to the tab it refreshes if it was due, which is why returning to DXLook often makes new spots pop in straight away.
- Want it right now? Click the button of the view you are already on. It re-centers the map and refreshes immediately, no matter where the countdown was.
How fast the data itself arrives
A refresh can only show what has already reached us, so the other half of the answer is how quickly each source feeds in:
- DX Clusters, RBN, PSK Reporter and APRS — continuous streams. A spot can be on the map seconds after it was reported.
- WSPRnet — collected every 10 minutes.
- Space weather (NOAA indices, D-RAP) — every 10 minutes.
- DXpedition announcements (NG3K) — every 30 minutes.
- The Replay recording — rebuilt every 15 minutes.
What you see on screen is limited by whichever is slower: the source, or the refresh of the view you are in.
15Data sources & credits
Spot data
- WSPRnet — wsprnet.org, wspr.live
- PSK Reporter — pskreporter.info (HTTP + MQTT)
- Reverse Beacon Network (RBN) — reversebeacon.net
- DX Clusters — telnet
- QRZ.com — qrz.com
- POTA — api.pota.app
- SOTA — api-db2.sota.org.uk
- APRS-IS — rotate.aprs.net
- NG3K ADXO — ng3k.com/Misc/adxo.html — DXpedition announcements, courtesy of W.B. Feidt
Propagation predictions
- VOACAP — HF propagation prediction engine, compiled from ITU data. Predictions are pre-computed by
voacapl.
Satellite tracking
- CelesTrak — TLE orbital data for amateur satellites.
- AMSAT — amsat.org
Space weather
The following indices are provided by the NOAA Space Weather Prediction Center (SWPC):
- K-index — geomagnetic activity (3-hour)
- A-index — average of the last eight 3-hour ap values (24 hours)
- Solar Flux Index (SFI) — solar radio emission at 10.7 cm
- Sunspot Number (SN) — daily value
- X-ray flux — solar-flare classification (A/B/C/M/X)
- Solar wind — speed and density
- Aurora oval prediction
- D-RAP — HF absorption prediction grids
NOAA data is provided "as is"; see NOAA's data disclaimer.
Map tiles
- OpenStreetMap — © OpenStreetMap contributors
- CARTO Voyager / Dark Matter — multilingual street basemap (Atlas, light & dark)
- Esri National Geographic — National Geographic reference style
- Esri World Topo Map — topographic / terrain layer
- Esri World Imagery — satellite imagery layer
Weather radar
- MSC Open Data — radar composite imagery from Environment and Climate Change Canada (ECCC), used under the Open Government Licence – Canada.
16Supporting DXLook
DXLook is free and has no ads. I’m Rodrigo, AK6FP; I build and run it in my spare time, and the server and data feeds are paid for by donations from the people who use it.
How donating works
The Support DXLook panel shows four amounts: $5, $10, $15 and $30. Click one and a window opens with that amount selected. Then choose how to pay:
- PayPal — with your PayPal account, or with a debit or credit card without an account. PayPal also lets you make the donation weekly or monthly.
- Stripe — by card, plus whatever other methods Stripe offers in your country.
Both open their own checkout page in a new tab. DXLook never sees your card or account details. When the payment is done you come back to DXLook, see a thank-you, and the donation reminder stops until next month.
The reminder appears at most once a day and closes by itself after 30 seconds. You can always open it from Why donate? in the panel.
The honor system
DXLook has no accounts, so it cannot tell who has donated. It takes your word for it. If you have donated this month, click I already donated this month in the donation window and the reminder stops until the first day of next month (UTC). Nobody checks.
The choice is saved only in your browser. On another computer or browser, click it once there too.
Why the smallest amount is $5
Payment processors charge a fixed fee on every payment, plus a percentage. On small amounts the fixed part takes a large share:
| Donation | PayPal keeps | Stripe keeps |
|---|---|---|
| $1 | $0.52 (52%) | $0.33 (33%) |
| $2 | $0.55 (27%) | $0.36 (18%) |
| $5 | $0.63 (13%) | $0.45 (9%) |
| $10 | $0.78 (8%) | $0.59 (6%) |
These are the US rates in October 2026: PayPal charges 2.89% + $0.49 per donation, and Stripe 2.9% + $0.30 per card payment. Payments from outside the US cost about 1.5% more. From $5 up, at least 87 cents of every dollar reaches DXLook, so the buttons start there.
If a donation isn’t possible right now, telling other hams about DXLook helps too.